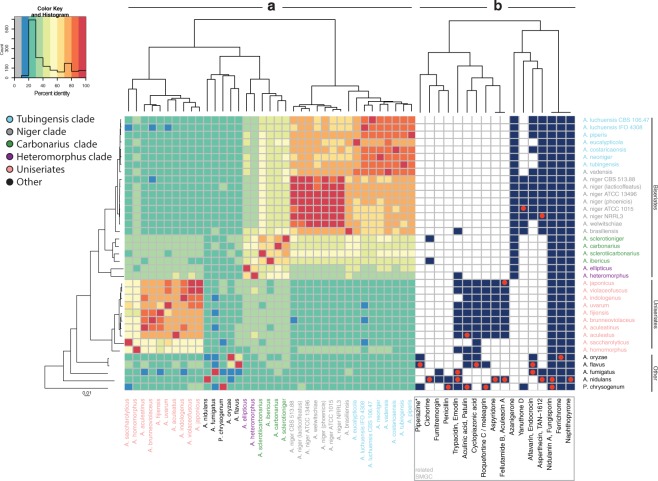
Figure 2.
Heatmap of shared SMGC families and gene clusters linked to compounds. This heatmap contains information on phylogeny of used strains, shared SMGC families and metabolite-linked gene clusters based on MIBiG entries. The row dendrogram represents a whole genome phylogeny. The column dendrogram was generated by creating a distance matrix of shared SMGC families by organisms and running hirarchical clustering with euclidean distance (part of the heatmap.2 function). (a) Relative amounts of shared SMGC families between species in percent. Here, the presence of SMGC families resulting from our pipeline was compared through all species. Percentage is indicated as color gradient in bins of 10% from grey cells (0–10%, not present in dataset) to red cells (90–100%) as shown by the color key. Additionally, a histogram indicates the abundance of different amounts of shared SMGC families, hence, how many comparisons result in low or high similarity respectively. Species self-comparison always results in values of 100%. The column dendrogram represents a hierarchical clustering of organisms by shared SMGC percent, hence strains clustering together will share a high amount of SMGCs. (b) Identification of compound-linked gene clusters based on MIBiG entries. Best hits for MIBiG entries, were identified inside families using protein BLAST (red dot). Aculinic acid and emodin gene clusters were confirmed by sequence identifier. Using a guilt-by-association approach, the whole family of gene clusters is considered to be responsible for the production of a similar metabolite. The heatmap column dendrogram is clustered hierarchically based on presence of compound-linked gene clusters. Dereplicated gene clusters that do not show related gene clusters in other species were removed. 4,4′-piperazine-2,5-diyldimethyl-bis-phenol is abbreviated as piparazine*.

