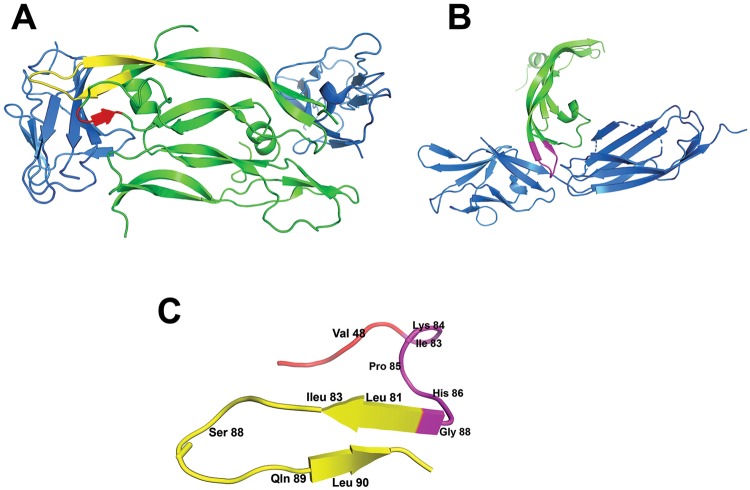
Figure 1.
Ribbon representation of VEGFB-VEGFR1 D2 complex (A), VEGFA-VEGFR2 D2 complex (B) and schematic representation of the structure of VGB4 peptide (C). Individual segments are highlighted in different colors: VEGFR1 D2 and VEGFR2 D2 are represented in blue whereas VEGF monomers are colored in green. The interacting regions in VEGFB-VEGFR1 D2 complex are colored in red and yellow. The interacting region in VEGFA-VEGFR2 D2 complex is colored in violet. The Figure was made using the software PyMOL (PYMOL Molecular Graphics System, Version 2.1 Schrödinger, LLC).

