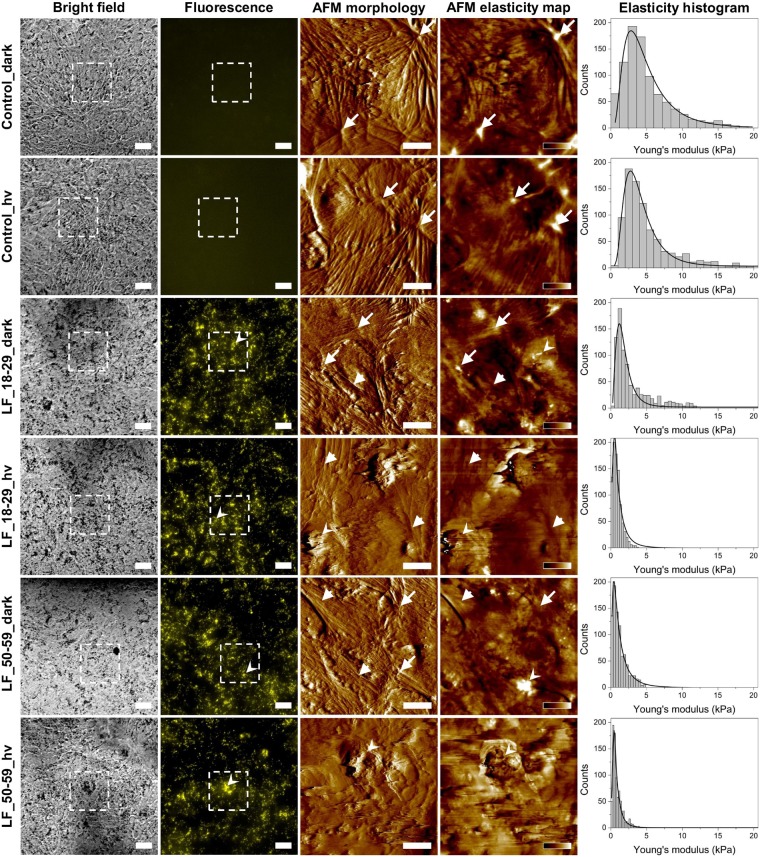
Figure 2.
Elasticity analysis of ARPE-19 cells with phagocytized lipofuscin granules. Bright field optical microscopy images (first column) of ARPE-19 cells followed by fluorescence images of the same areas (second column). Dotted squares in the images represent scanning areas covered with AFM. Scale bars for both bright field and fluorescence represent 20 µm. In the case of fluorescence images of control cells without LF granules, camera settings were the same as for images of cells with LF particles. AFM amplitude images showing cell morphology (third column) followed by elasticity map of the Young’s modulus values (forth column). Scale bars in amplitude images represent 10 µm, whereas color bars in the elasticity maps indicate values of the Young’s modulus ranging from 0 to 20 kPa (dark-to-bright) for control_dark and control_hv cells, from 0 to 10 kPa for LF_18–29_dark cells, from 0 to 5 kPa for LF_18–29_hv and LF_50–59_hv and from 0 to 2 kPa for LF_50–59_hv cells. Arrows indicate thick actin stress fibers, arrow heads thin actin filaments, whereas sharpened arrow heads LF particles. Histograms of the Young’s modulus values (last column) with log-normal fit to the data.

