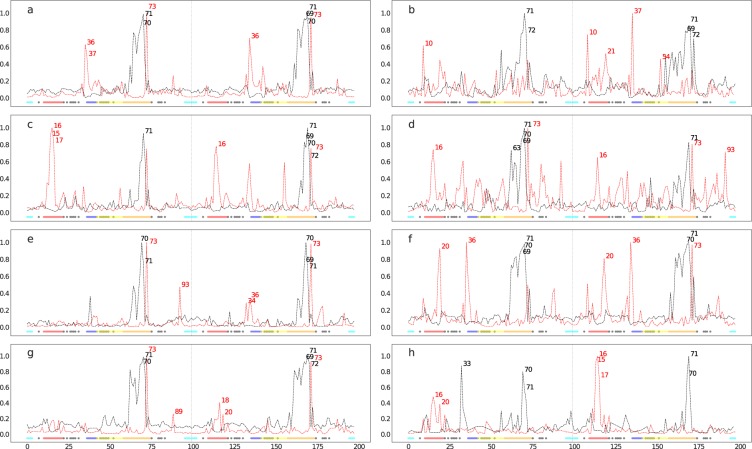
Figure 4.
Normalized degree centralities of significantly larger (red lines) and smaller (black lines) distances observed in resistant ensembles for 8 FDA-approved protease inhibitor complexes, namely ATV (a), DRV (b), FPV (c), IDV (d), LPV (e), NFV (f), SQV (g) and TPV (h). The top 5 residue positions with the highest connectivities are labelled at the peaks in each graph. Inserted underneath are the functional protease residues depicted as colored dots, namely the fulcrum  , the elbow
  , the flap
  , the cantilever
  , the interface
  and the binding cavity residues
  .
.

