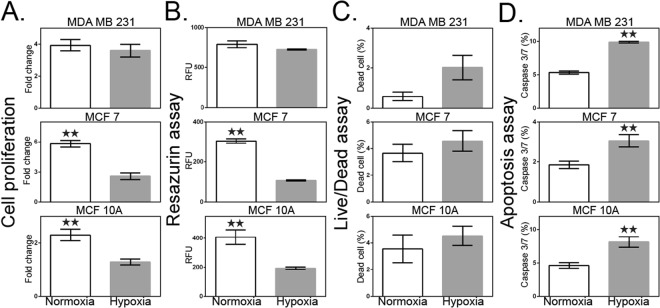
Figure 1.
Effect of hypoxia on cell proliferation and viability. (A) Rate of proliferation defined by the ratio of the number of viable cells at day 5 to the number of viable cells at day 1. (B) Metabolism assay using resazurin dye. Cellular metabolic activity is measured as relative fluorescence units (RFU). (C) Flow cytometric analysis of live/dead fixable aqua dead cell stain using the SYTOX assay. (D) CellEvent Caspase-3/7 Green was used to measure an early indicator of apoptosis of cells destined for cell death. White bar represents normoxia. Grey bar represents hypoxia. Data are presented as the mean ± SEM of triplicate samples. **p < 0.01 versus normoxia-treated cells.

