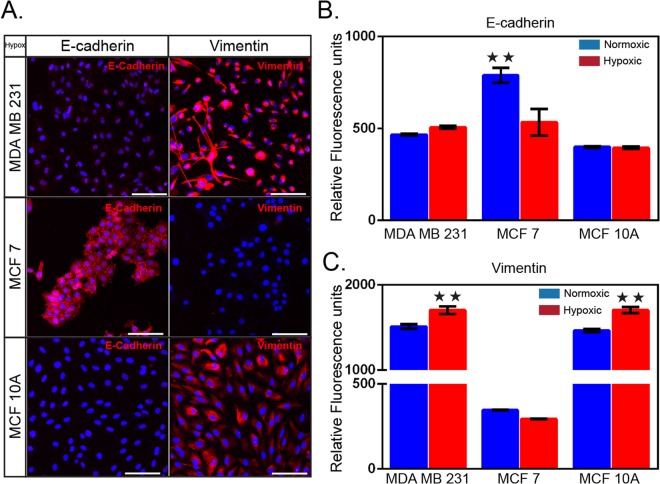
Figure 2.
Changes in cell morphology and gene expression under hypoxia. (A) Immunofluorescent staining (red) of the epithelial marker E-cadherin (HECD-1) and the mesenchymal marker vimentin (V9). Three human breast cell lines, MDA-MB-231, MCF-7, and MCF-10A cells were cultured in hypoxia for 72 h prior to staining. The secondary antibody is rabbit anti-mouse labelled with AlexaFluor 594. Cell nuclei were stained with DAPI. Relative fluorescence intensity of (B) E-Cadherin and (C) vimentin. Cells were cultured in normoxic and hypoxic conditions for 72 hours prior to the staining. Mean ± S.E.M. data are shown (n = 3); **p < 0.01 (Student’s t test). Scale bar is 100 µm.

