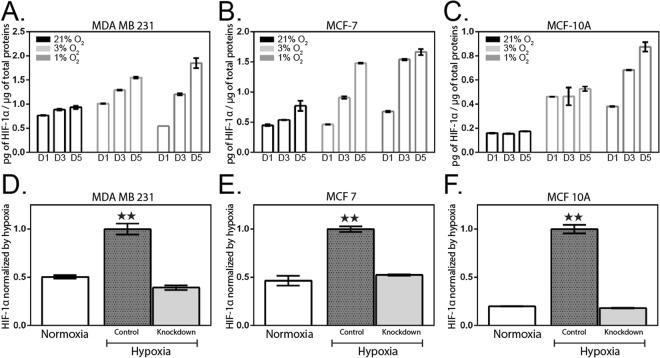
Figure 3.
HIF-1α measurement in hypoxic-induced cell lines. Three breast cell lines; (A) MDA-MB-231, (B) MCF-7, and (C) MCF-10A, were harvested after 1-, 3-, 5-days under normoxic (21% O2) and hypoxic (1% and 3% O2) conditions. Normalized HIF-1α levels over total protein levels. (D–F) HIF-1α knock-down using siRNA. Corresponding bar graphs represent relative HIF-1α normalized to the respective control cells in hypoxic condition. Data are presented as the mean ± SEM of duplicate independent samples. **p < 0.01 versus hypoxia-treated cells; n = 2 due to consistent datasets.

