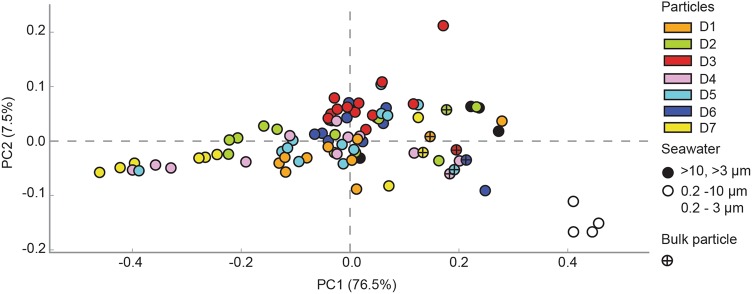
Fig. 4.
Principal component analysis (PCA) plot calculated using the 16S rRNA gene class level of the taxonomical hierarchy for each sample. The two first principal components are plotted with the proportion of variance explained by each component indicated in brackets. The numbers of sequences were normalized to the total number of sequences in each library and unclassified sequences were retained. Each sample is represented by a circle, with a color indicating the net trap number or the fraction of the seawater. Bulk particle samples for each net trap are labelled with a (+) in the circle

