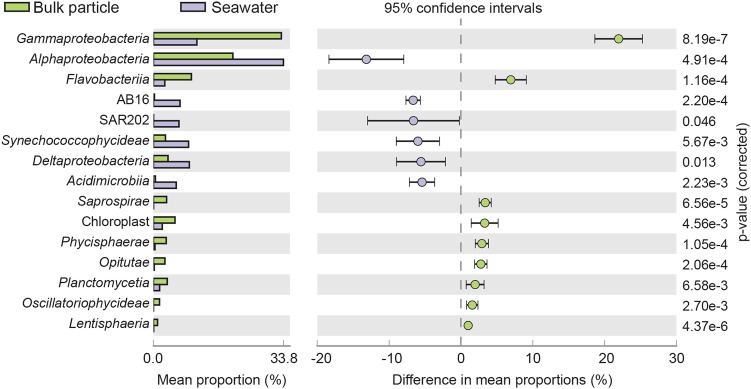
Fig. 5.
Bar plot showing the mean proportion and the difference in mean proportion (16S rRNA gene) between the respective groups of significantly enriched (p < 0.05; Welch’s t-test) classes with a difference in mean proportions of >1%. Error bars indicate standard deviation and corrected p-values are indicated to the right. The small size fraction seawater samples (0.2–10 and 0.2–3 µm) are shown in purple, and bulk particle samples from each net trap (D1–D7) are shown in green

