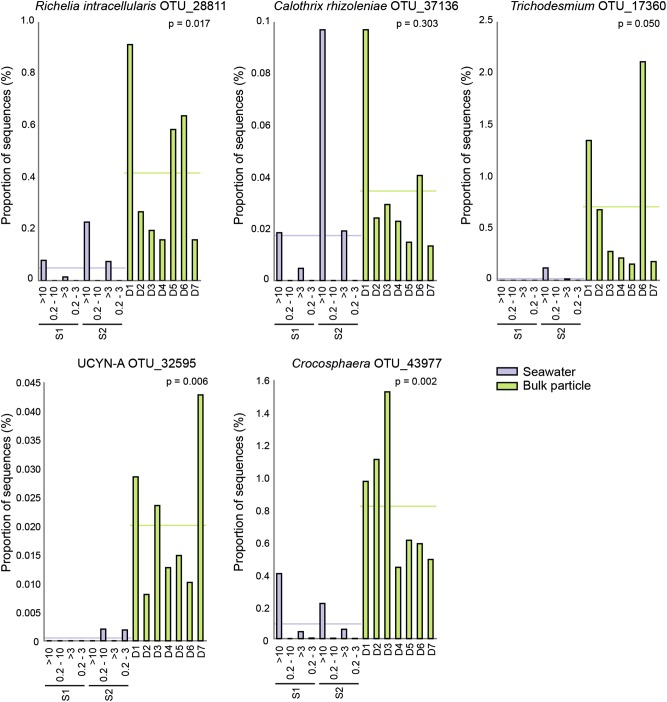
Fig. 6.
Group comparison of the sequence library proportions of OTUs related to the 16S rRNA genes of known diazotrophs (>97% identity) in seawater and bulk particle samples. The bar plots show the proportion of sequences for each sample. The seawater samples (S1 and S2; >10, 0.2–10, >3, and 0.2–3 µm) are shown in purple and the bulk particle samples from each net trap (D1–D7) are shown in green. The horizontal line in each graph shows the mean proportions of sequences for the respective sample groups and p-values are given for each graph

