
FIGURE 1.
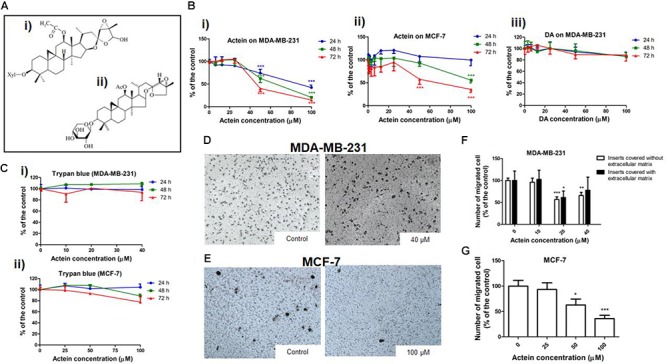
Actein inhibited cell migration in MDA-MB-231 and MCF-7 cells. (A) Chemical structure of (i) actein and (ii) DA. (B) Cytotoxic effects of actein (6.25 – 100 μM) on (i) MDA-MB-231 and (ii) MCF-7 cells, and (iii) DA on MDA-MB-231 cells upon 24, 48, or 72 h treatment were performed using MTT assay. Data were expressed as the mean fold of untreated controls (mean ± SD of 3 independent experiments with 5 replicates each). (C) Trypan blue assay of actein on (i) MDA-MB-231 cells and (ii) MCF-7 cells (mean ± SD of 3 independent experiments with 5 wells each). Cells were treated with actein for 5 h in transwell migration assay and invasion assay using matrigel. Representative photographs show the stained migrated (D) MDA-MB-231 cells or (E) MCF-7 cells on the lower side of the membrane after incubation. (F,G) Quantitative analysis summarized the number of migrated cells on the lower chambers (mean + SD of 3 independent experiments with duplicates each) and expressed as the percentage of the control. Differences among the treated and vehicle treated control groups were determined by one-way ANOVA. ∗p < 0.05, ∗∗p < 0.01, and ∗∗∗p < 0.001 as compared to control group.