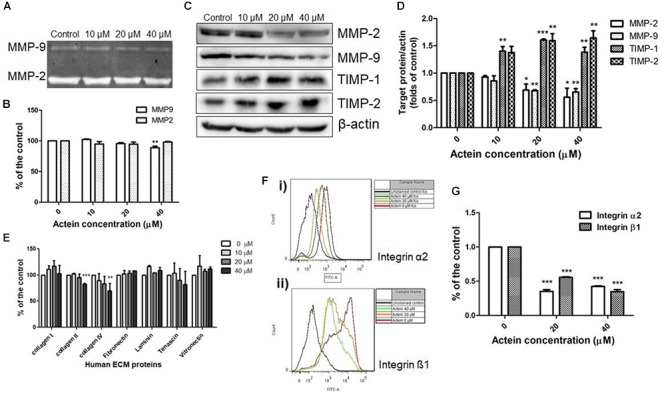
FIGURE 4.

Effects of actein on cell adhesion to ECM proteins and matrix degradation. (A) Representative photographs show the activities of MMP-2 and MMP-9 on the stained gelatin gel. (B) The effects on MMP9 and MMP2 activities were represented by the digested gelatin on the gel in gelatin zymography assay. Results were expressed as fold of untreated controls (mean + SD of 4–5 independent experiments in duplicate). (C) Representative Western blots show the effect of actein on the expressions of MMP-2, MMP-9, TIMP-1, and TIMP-2 of MDA-MB-231 cells after 24 h treatment with or without actein. (D) The histograms show the quantified results of the expressions of the ECM-associated proteinases, which were normalized with corresponding β-actin protein expression and expressed as fold of untreated controls (mean + SD of 4 independent experiments). (E,F) Effects of actein on breast cancer cell adhesion. (E) In ECM-adhesion assay, MDA-MB-231 cells treated with or without actein were added to wells pre-coated with ECM proteins for 2 h. Results were expressed as the mean fold of the untreated controls (mean + SD of 3 independent experiments in duplicates). (F) Representative flow cytometric histograms show the inhibitory effect of actein on (i) integrin α2 and (ii) β1 expressions. (G) Bar charts show the expressions of integrins α2 and β1 using flow cytometry and expressed as fold of control (mean + SD of 4 independent experiments). Statistical differences were determined by One-way ANOVA, ∗p < 0.05, ∗∗p < 0.01, and ∗∗∗p < 0.001 against untreated control.
