
FIGURE 5.
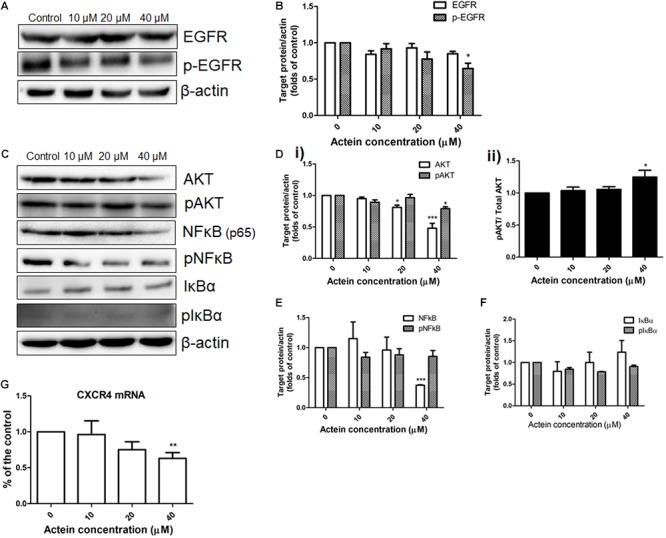
Effects of actein on expression of proteins in various signaling pathway in MDA-MB-231 cells. (A,C) Representative Western blots shows the expressions of EGFR signaling pathway related proteins in MDA-MB-231 cells. After MDA-MB-231 cells were treated with or without actein (10 – 40 μM) for 24 h, whole cell lysate was subjected to Western blotting. (B,D,E,F) Bar charts shows the results of proteins EGFR, p-EGFR, AKT, pAKT, NF-κB, pN-FκB, IκBα, and pIκBα using Western blot analysis, which were normalized with corresponding β-actin protein expression and expressed as fold of control (mean + SD of 4 independent experiments). (G) Quantitative RT-PCR analysis shows the mRNA expressions of CXCR4 in MDA-MB-231 cells after treatment with or without actein. Data were normalized to corresponding human GAPDH expressions. mRNA expressions results are expressed as fold of control. Statistical differences were determined by one-way ANOVA, with ∗p < 0.05, ∗∗p < 0.01, and ∗∗∗p < 0.001 against untreated control.