FIGURE 6.

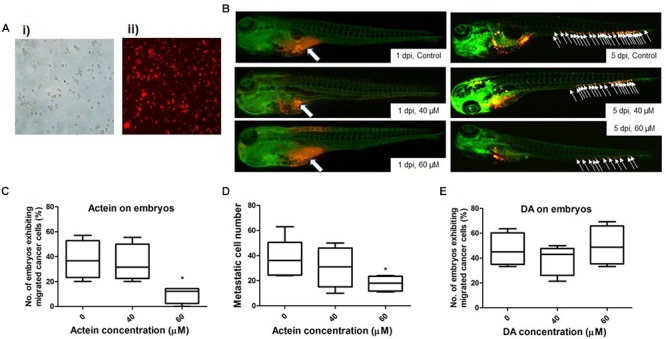
Actein decreased breast cancer cell migration in the zebrafish embryos. (A) Representative images of MDA-MB-231 cells before (i) and after (ii) CM-Dil staining (100 × magnification) are shown. (B) Representative images show breast cancer cells visualized by the red fluorescent dye (white arrows) (n = 360). The images on the left panel represent embryos at 1 day post injection with all cells remained in the yolk sac. White arrows in the images on the right panel indicate breast cancer cells disseminated from the injection site (yolk sac) at 5 dpi. (C) The number of embryos exhibiting migrated cancer cells was significantly lower in 60 μM treatment group compared to the control group. The results were represented as the mean + SEM of 4 independent experiments (n = 360). (D) Fiji software analysis on the images (mean + SEM of 4 independent experiments). (E) DA shows no effect on the embryos exhibiting migrated cancer cells. Statistical differences were determined by One-way ANOVA, ∗p < 0.05 vs. untreated control.
