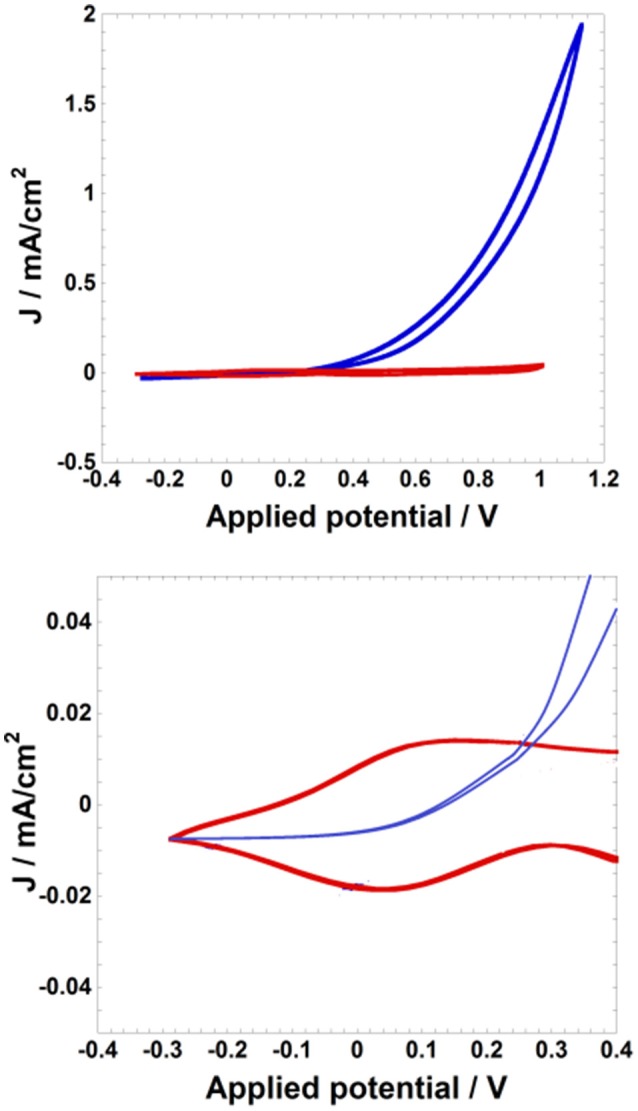
Figure 2.

Cyclic voltammetries of a NiO film (l: 4 μm) at the scan rate of 10mV s−1 in two different electrolytes (red curve: 0.2M LiClO4 in acetonitrile; blue curve: 0.2M LiI and 0.02 M I2 in acetonitrile). Potential values are referred to the redox couple Ag/AgCl. Top: voltammograms in the full scale of current; bottom: zoom of the two voltammograms in correspondence of the onset of NiO (red profile) and I− (blue profile) oxidations. Reproduced with permission from Bonomo et al. (2016b).
