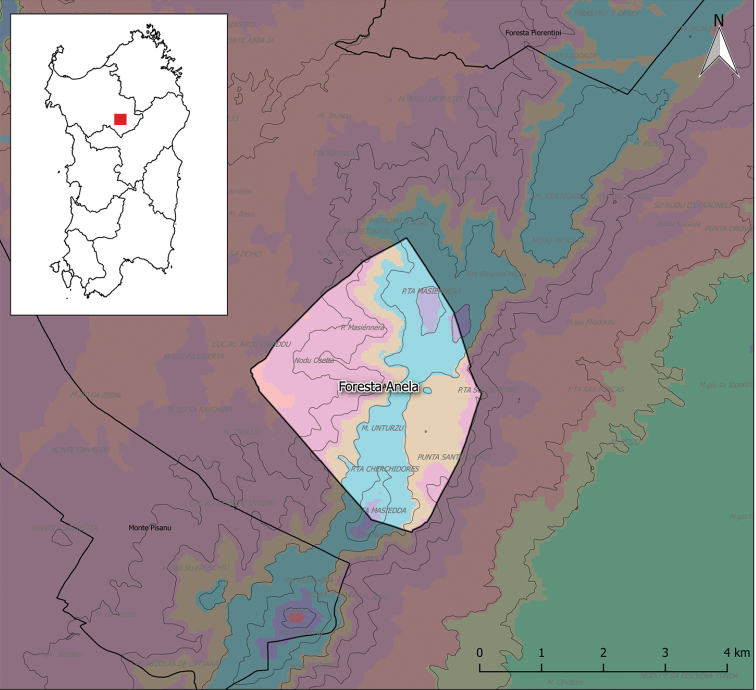
Figure 1.
The study area, Forest of Anela and its location in Sardinia (red rectangle on the inset map). Colours on the map represent different isobioclimates (derived from Canu et al. 2015). In the domain, we can recognise five different isobioclimates: Violet: upper mesotemperate (subMediterranean), lower humid, weak semi-continental; blue: lower supraMediterranean, lower humid, weak semi-continental; orange: upper mesoMediterranean, lower humid, weak semi-continental; lilac: upper mesoMediterranean, upper subhumid, weak semi-continental; pink: upper mesoMediterranean, lower subhumid, weak semi-continental. Thick black lines represent domain limits; thin black lines represent altitude intervals of 100 m.

