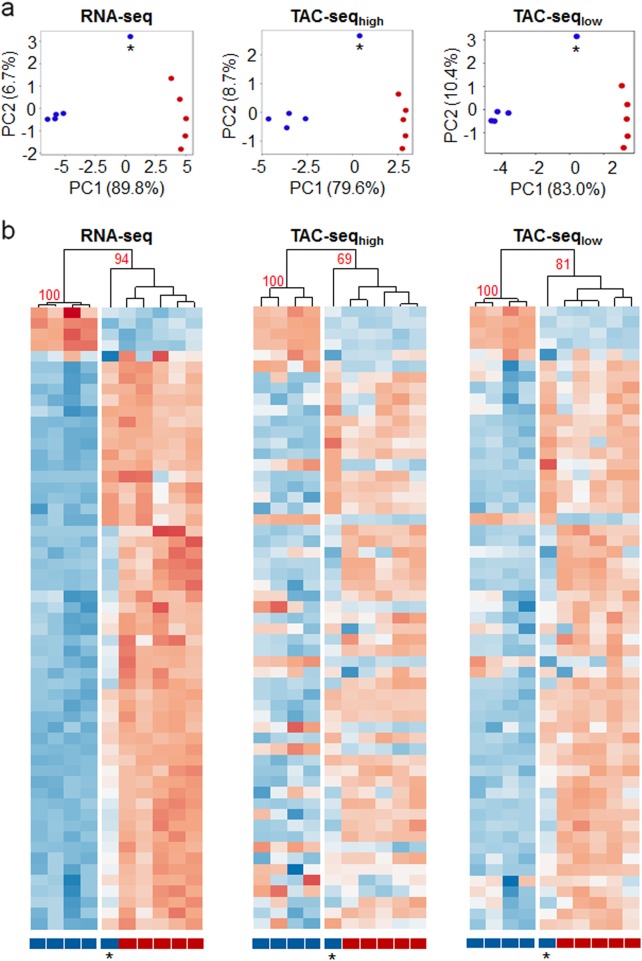
Fig. 2.
Comparison of the overall predictions for mRNA TAC-seq assay. a Principal component analysis of the full transcriptome RNA-seq, high-coverage TAC-seq and low-coverage TAC-seq of ten endometrial samples. The first principal component (PC1) describes most of the sample variability and correlates most with the receptivity status. Blue dots represent pre-receptive and red dots receptive human endometrial samples. One separate pre-receptive sample (indicated with an asterisk) represents the same sample that clusters differently in the heatmap analysis (below) and is, therefore, a potential biological outlier. b Heatmaps of the full transcriptome RNA-seq, high-coverage-, and low-coverage TAC-seq show the sensitivity to distinguish different endometrial samples according to their receptivity. One pre-receptive sample (indicated with an asterisk) shares the expression profile and clusters together with receptive samples in all three comparisons. Pre-receptive samples are labeled blue and receptive red. Detailed heatmaps are presented in Supplementary Fig. 3 together with housekeeping genes that demonstrate a lack of fluctuation of the pre-receptive and receptive biopsies. High-coverage TAC-seq data are presented at UMI = 2 and low-coverage data at UMI = 1 on PCA and heatmaps. Higher UMI thresholds in both high- and low-coverage approaches left low-expressed biomarker genes, like APOD, EDN3 etc without reads, according to Supplementary Fig. 4. The data are plotted as row-wise scaled log-transformed counts per million (CPM) values. The samples are hierarchically clustered column-wise using Pearson correlation. The genes are ordered row-wise according to the RNA-seq clustering results using Euclidean distance. Fewer genes are found expressed with a low-coverage compared to RNA-seq and high-coverage TAC-seq

