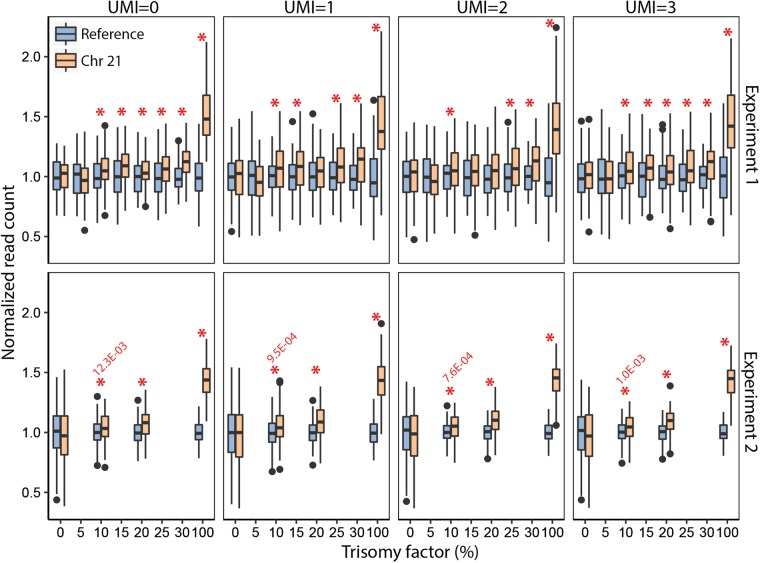
Fig. 4.
Trisomy detection under in vitro conditions. Boxplots over applied UMI thresholds of normalized molecule counts (y-axis) of trisomy TAC-seq experiments indicates a positive correlation between the trisomy factor (x-axis, trisomic cell proportion) and chr21 counts. Experiment 1, upper four plots, involved 114 loci along chr2 and chr21. One biological replica is depicted. Experiment 2, lower four plots at various UMI thresholds, involved extended TAC-seq probe set (in total 224 probes) along chr2, chr3, and chr21. The red asterisks indicate significant reference chromosome(s) and chr21 read-count-based differences between studied samples (p < 0.05, one-tailed Welch’s t-test)

