Fig. 4.
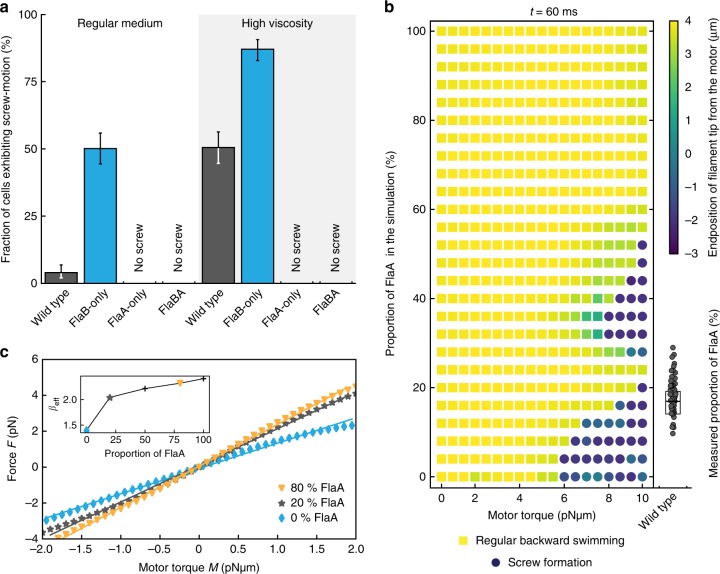
Experimentally observed and simulated screw formation. a The probability of screw formation of wild-type (FlaAB) and FlaB-only cells increases in high viscosity, while for FlaA-only and FlaBA screw formation was never observed. Significance was tested for all filament combinations under both conditions and for each filament between the two conditions. If no screw was observed at all, significance was not tested. All tested combinations were significant (P < 0.05, Bonferroni corrected). Error bars indicate 95% confidence intervals. About 300 cells were counted for each strain. b Observation of screw formation for varying flagellin compositions at different motor torques after a simulation time of t = 60 ms. The simulation was carried out for flagella with an increasing number of FlaA segments, starting with a flagellum completely composed of FlaB (bottom of the diagram) and successively exchanging the segments to a FlaA configuration starting from the filament’s base. Yellow squares indicate regular backward rotation, blue dots indicate screw formation. The color coding represents the z-position of the flagellum’s free end, with negative values indicating a position below the motor segment (position 0). For comparison with the actual flagellin composition in the wild type experimentally measured FlaA proportions are given on the right. Data points are displayed as individual values (gray dots) measured for 50 filaments. The box spans the central half of the data, the black bar indicates the median. A movie of the simulation with FlaA-only and FlaB-only filaments is provided as Supplementary Movie 2. c Force-torque relation extracted from the numerical simulation. The mean force F on the flagellum varies linearly with motor torque M for both forward and backward swimming. Shown are the relations for a FlaB-only flagellum (blue diamonds), a 20% admixture of FlaA (gray stars) and an 80% admixture (orange triangles). The continuous lines are linear fits to the data. The slope βeff in F = βeff M versus the FlaA content is shown in the inset: it increases rapidly up to about 20% FlaA and more slowly for larger fractions. A higher value of βeff indicates a more efficient transfer of torque into driving force

