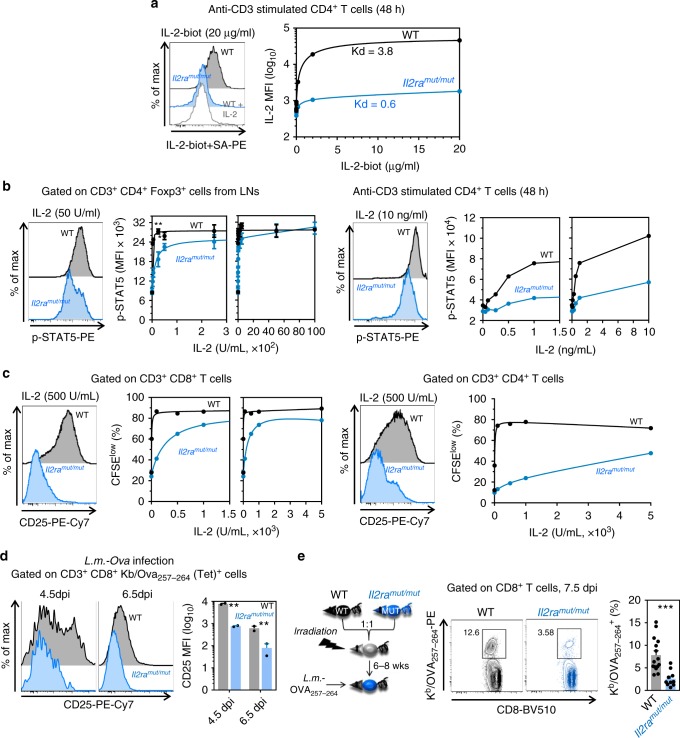
Fig. 2.
The Y129H mutation in CD25 impairs IL-2 binding, signaling and T cell proliferation. a Recombinant human IL-2 was biotinylated and incubated with anti-CD3 stimulated purified CD4+ T cells from Il2ramut/mut or WT mice prior to staining with streptavidin PE. Unbiotinylated IL-2 was added to WT T cells as a control of binding specificity. Representative FACS histograms of IL-2 or no IL-2 bound to mutant or WT T cells are shown. The graph plots IL-2 binding signals (MFI) with increasing concentration of biotinylated IL-2. IL-2 Kd (50% binding capacity) for Il2ramut/mut or WT T cells are shown. b Purified CD4+ T cells from LNs of Il2ramut/mut or WT mice (n = 3) were incubated in serum-free media (30’) and with IL-2 (20’) before proceeding to intracellular STAT5 phosphorylation staining. FACS histograms of STAT5 phosphorylation levels in Foxp3+ Treg (left) and anti-CD3 activated CD4+ Tconv (right) cells are shown. Graphs plot phosphorylated STAT5 expression with increased IL-2 concentrations. c Purified LN CD4+ or CD8+ T cells from Il2ramut/mut or WT mice were CFSE-labeled and incubated with anti-CD3 and IL-2. The proportion of CFSElow T cells was determined by FACS 4 days later. Graphs plot the % CFSElow T cells as IL-2 increases in 1 of 3 replicate experiments. FACS histograms show cell-surface CD25 expression in Il2ramut/mut or WT T cells 4 days post IL-2 incubation. d Il2ramut/mut or WT mice (n = 2) were immunized i.v. with 104 WT Listeria monocytogenes (Lm) expressing Ovalbumin (Lm-Ova) and spleen cells were stained at indicated days with Ova257-264/Kd tetramers (Tet+) and anti-CD25. Representative FACS histograms of CD25 expression on tet+ CD8+ T cells is shown with a summary bar graph. e WT/Il2ramut/mut mixed bone-marrow (BM) chimeras (ratio 1:1) with discriminative CD45.1/2 congenic markers were immunized i.v. with WT Lm-Ova and 7.5 days later spleen cells stained with Ova257-264/Kd tetramers. Representative FACS dot plots and summary bar graphs of Lm-specific Il2ramut/mut or WT tet+ CD8+ T cells are shown (n = 15 mice). p-values are indicated with *p < 0.05; **p < 0.01; ***p < 0.001; NS not significant, using two-tailed unpaired Student’s t-test. Error bars are mean ± SEM in all figures

