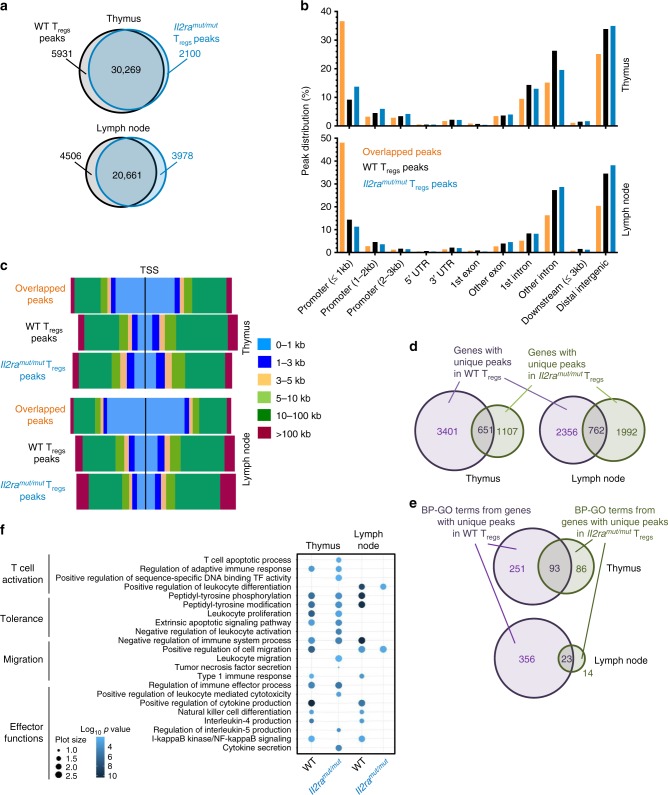
Fig. 3.
IL-2 makes substantial modifications in the epigenetic landscape of Treg cells: Treg cells (5 × 10⁴) were sorted by flow cytometry from thymus or LNs of Il2ramut/mut and WT Foxp3Rfp/Rfp reporter mice, lysed and DNA from nucleus extracted for analysis of open chromatic regions by ATAC-seq. a Venn diagram of number of common and unique ATAC-seq peaks (OCRs) in Il2ramut/mut vs WT Treg cells from thymus and LNs. b, c Distribution of common and unique ATAC-seq peaks across gene organization (b) and distance to the transcription start site (TSS, c) in the whole genome. d, e Venn diagrams of number of genes (d) and GO pathways (e) exhibiting unique peaks in Il2ramut/mut vs WT thymic and LN Treg cells on all (d) or within (e) 20 kb from TSS. f Network analysis of biological-process GO term enrichment among genes with unique peaks within 20 kb from TSS in Il2ramut/mut or WT thymic and LN Treg cells. Genes were analyzed for over-represented GO terms using ReviGO. Node color is proportional to the FDR-adjusted p-value of the enrichment. Node size is proportional to gene set size

