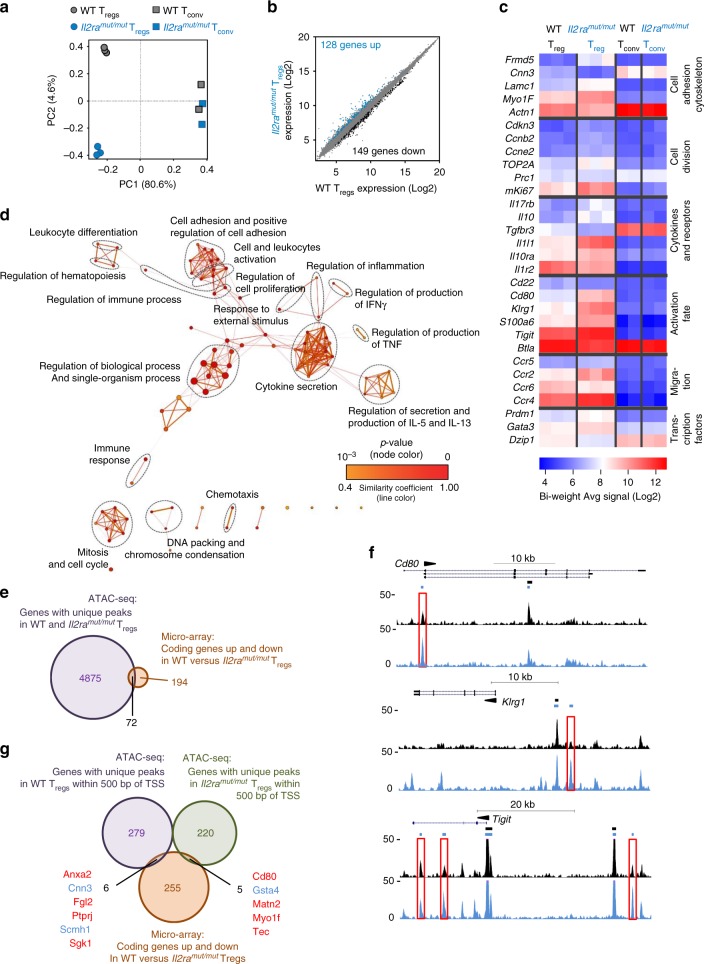
Fig. 4.
The expression of only a small set of genes in Treg cells is altered by low IL-2 signals: a 5 × 10⁴ Treg and Tconv cells were sorted by flow cytometry from LNs of three independent replicate Il2ramut/mut or WT Foxp3Rfp/Rfp reporter mice and total RNA extracted and reverse transcribed to cDNA. Affymetrix mouse expression arrays (Pico 1.0) were then conducted. Principal component analysis (PCA) of expressed genes using the top 10% of genes with the highest variance in analyzed groups with each symbol featuring one mouse. b Scatter plot of individual genes expressed in Il2ramut/mut vs WT Treg cells. Significantly upregulated and downregulated genes, defined as genes with at least 1.5 fold change, p-value ≤ 0.01, are colored blue or black, respectively, and numbers are shown. c Heat map of selected genes grouped under various categories as indicated and for which expression is significantly different between Il2ramut/mut and WT Treg cells. d Network analysis of biological-process gene-ontology (GO) term enrichment among significantly upregulated genes in Il2ramut/mut vs control WT Treg cells. Upregulated genes were analyzed for over-represented GO terms using BiNGO in Cytoscape, and the resulting network was calculated and visualized using EnrichmentMap. Groups of similar GO terms were manually circled. Line thickness and color are proportional to the similarity coefficient between connected nodes. Node color is proportional to the FDR-adjusted p-value of the enrichment. Node size is proportional to gene set size. e Venn diagram comparing differentially expressed genes in Il2ramut/mut vs WT Treg cells to genes with unique peaks called in Il2ramut/mut and WT Treg cells found in ATAC-seq in Fig. 3 based on gene symbols. f ATAC-seq tracks for 3 sample genes with at least 1 unique peak localized in distinct regions of the gene (promotor, intronic, intergenic). g Three-way Venn diagram comparing differentially expressed genes in Il2ramut/mut versus WT Treg cells to genes containing unique peaks close to TSS (<500 bp) in Il2ramut/mut vs WT Treg cells found in ATAC-seq

