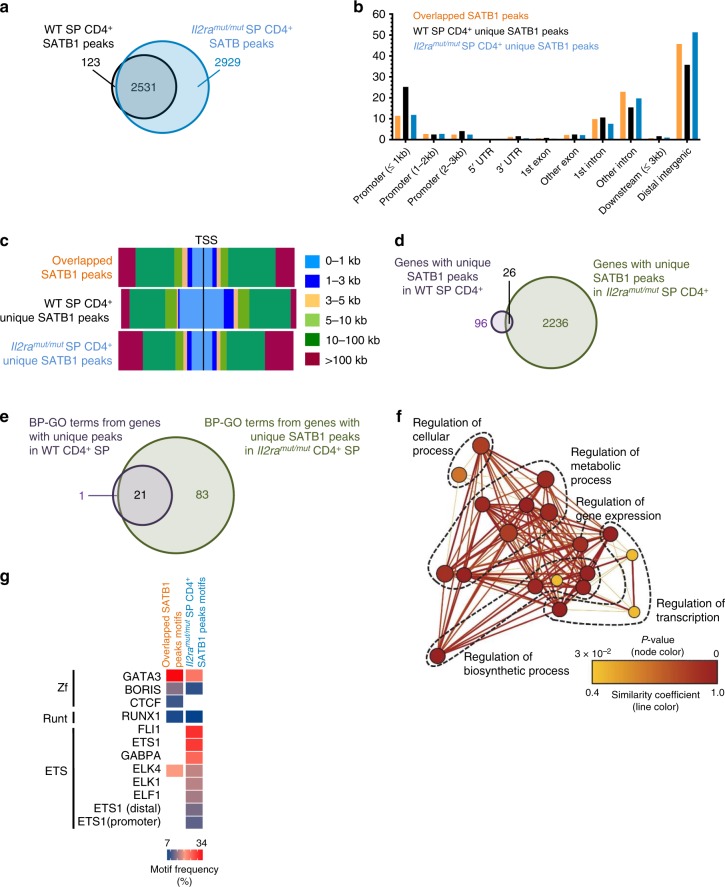
Fig. 5.
Ectopic DNA binding of SATB1 in SP CD4+ thymocytes receiving low IL-2 signals: 2 × 10⁶ SP CD4+ thymocytes were sorted in 2 independent duplicate experiments by flow cytometry from the thymus of Il2ramut/mut and WT mice, PFA fixed, lysed, and cross-linked DNA was used for chromatin immunoprecipitation sequencing (ChIP-seq) of the pioneer factor SATB1. a Venn diagram of the number of common and unique SATB1 DNA binding peaks in Il2ramut/mut vs WT SP CD4+ thymocytes. b, c Distribution of common and unique SATB1 DNA binding peaks across gene organization (b) and distance to the transcription start site (TSS, c) in the whole genome. d Venn diagram of the number of genes exhibiting unique SATB1 DNA binding peaks in Il2ramut/mut vs WT SP CD4+ thymocytes. e Venn diagram of biological-process gene-ontology (BP-GO) from genes with unique SATB1 DNA binding peaks in WT vs Il2ramut/mut SP CD4+ thymocytes. f Network analysis of BP-GO term enrichment among genes with unique SATB1 DNA binding peaks in WT SP CD4+ thymocytes. Genes with unique SATB1-binding peaks were analyzed for over-represented GO terms using BiNGO in Cytoskape, and the resulting network was calculated and visualized using EnrichmentMap in Cytoscape. Groups of similar GO terms were manually circled. Line thickness and color are proportional to the similarity coefficient between connected nodes. Node color is proportional to the FDR-adjusted p-value of the enrichment. Node size is proportional to gene set size. g Frequency of known TF binding site motifs enriched in common and unique SATB1 DNA binding peaks in WT and Il2ramut/mut SP CD4+ thymocytes. Motif frequency (%) is shown in heat map

