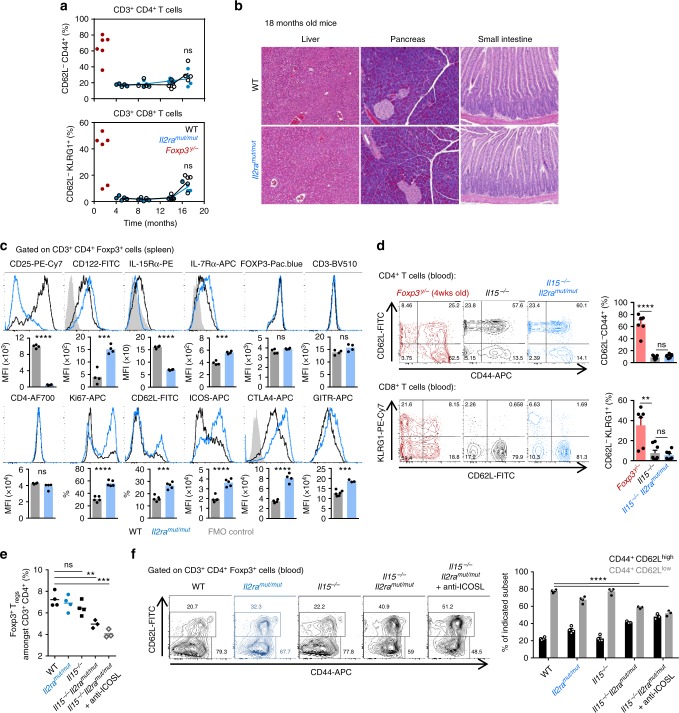
Fig. 6.
Il2ramut/mut mice do not develop any signs of autoimmunity: a T cells collected from blood of Il2ramut/mut and WT mice were stained for cell-surface CD3, CD8, CD4 and CD62L, CD44, KLRG1 activation markers at indicated times over an 18 months period. Blood from control Foxp3y/− was analyzed at ~1.5 months post birth. Each symbol represents an individual mouse. b At month 18, liver, pancreas, and small intestine were harvested, fixed/cut, and stained with H/E. c Spleen cells from 8 to 10-weeks-old Il2ramut/mut and WT mice were stained for cell-surface CD3, CD4, intracellular Foxp3 and indicated markers. Overlay of representative FACS histograms after gating on CD3+CD4+Foxp3+ T cells are shown and bar graphs average relative expression levels (MFI, n = 4–5). d Blood from Il2ramut/mutIl15−/−, Il15−/− (6 months old) or Foxp3y/− mice was stained as in a and representative FACS dot plots with bar graphs summarizing average across mice (n = 6–7) are shown. e Proportion of peripheral blood Foxp3+ Treg cells among CD3+CD4+ T cells in indicated mice treated (or not) with anti-ICOSL for 2 weeks. f Blood leukocytes from indicated mice groups were stained for expression of CD3, CD4, intracellular Foxp3, CD62L, CD44. Representative dot plots and summary bar graphs of average CD44/CD62L expression levels across all groups of mice are shown (n = 3–4). p-values are indicated when relevant with *p < 0.05; **p < 0.01; ***p < 0.001; NS not significant, using two-tailed unpaired Student’s t-test

