Fig. 7.
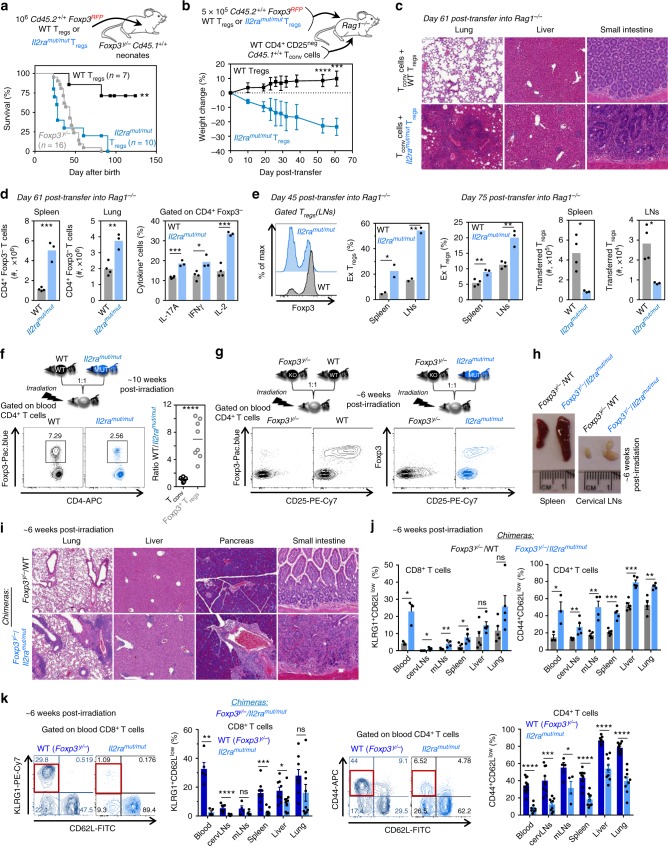
Treg cells receiving limited IL-2 signals cannot suppress autoreactive WT Tconv cells: a Foxp3y/− Cd45.1+/+ neonate mice were transferred i.p. with 106 Il2ramut/mut or WT flow-purified Foxp3Rfp/Rfp CD3+CD4+ Treg cells and survival was monitored over 120 days. Graphs average results over multiple mice in each group and 7-16 replicate experiments. b, c Rag1−/− mice received 5 × 10⁵ flow-purified Foxp3Rfp/Rfp CD3+CD4+ Treg cells together with 1.5 × 10⁶ WT CD3+CD4+CD25neg Tconv cells i.v. Weight loss was monitored up to 61 days post transfer and immune cell infiltrates on H/E stained sections is shown at day 61 (n = 4). d Numbers of transferred Foxp3Rfp/Rfp CD3+CD4+ Treg cells in the spleen and lung of Rag1−/− mice (left bar graphs) and proportion of cytokine-secreting CD3+CD4+ Tconv cells 4 h post PMA/ionomycin stimulation. e Foxp3 expression in Foxp3Rfp/Rfp CD3+CD4+ Treg cells 45 and 75 days post transfer, proportion and absolute numbers of ex-Treg cells in LNs and spleens. f, g Schematic of mixed bone-marrow chimera generation in lethally irradiated WT B6 recipient mice with discriminative congenic markers. f, g Representative FACS dot plots of Foxp3 and CD4 expression in blood T cells of f WT/Il2ramut/mut and g Foxp3y/−/WT and Foxp3y/−/Il2ramut/mut chimeras 10 and 6 weeks post reconstitution, respectively. Graph in f shows the ratio of WT vs Il2ramut/mut Tconv and Treg cells for each individual chimera. Data are across several chimeras (5–9 mice/group) in 3–4 replicate experiments. h, i Spleen, LN pictures, and H/E stained sections of lung, liver, pancreas, and small intestine from Foxp3y/−/WT and Foxp3y/−/Il2ramut/mut chimeras. j Cells from indicated organs from the two groups of chimeras were stained for cell-surface expression of CD3, CD4, CD8, CD62L, KLRG1, and CD44. Bar graphs show the proportion of activated CD4+ (CD44+CD62Llo) or CD8+ (KLRG1+CD62Llo) T cells (n = 5–9). k Proportion of activated CD3+CD4+ or CD8+ Tconv cells from Il2ramut/mut or WT BM in Foxp3y/−/Il2ramut/mut chimeras. Bar graphs summarize average proportion across mice (n = 5–9). p-values are indicated when relevant with *p < 0.05; **p < 0.01; ***p < 0.001; NS not significant, using two-tailed unpaired Student’s t-test. Symbols on bar graphs feature individual mice

