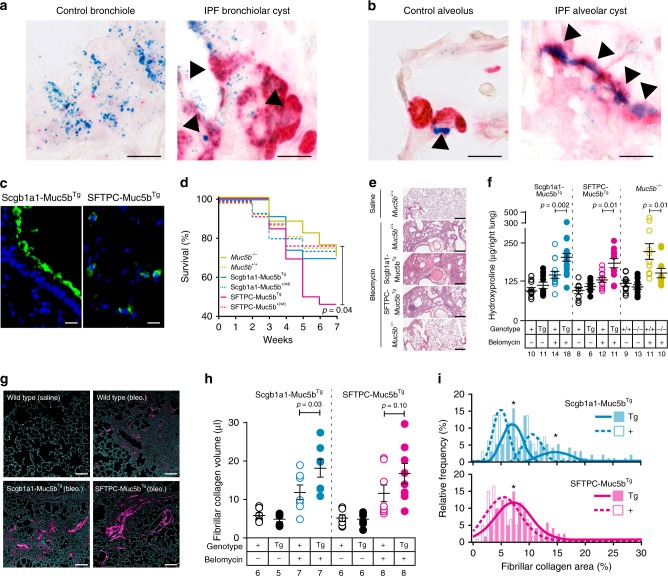
Fig. 1.
Muc5b overexpression in the distal lung is associated with greater fibrogenesis following bleomycin. a, b In situ hybridization of human lung specimens from control and IPF subjects with MUC5B variant rs35705950. Arrowheads depict cells co-expressing SFTPC (red) and MUC5B (blue) in control bronchioles and IPF bronchiolar structures a and in control type 2 alveolar epithelia and IPF type 2 alveolar structures b. c Transgenic mice expressing Muc5b under control of the mouse Scgb1a1 and the human SFTPC promoters demonstrate Muc5b protein in conducting airways and in type 2 alveolar epithelia. d, e After repeated doses of bleomycin (2.5 U/kg, IT on day 0, 1.5 U/kg on days 14 and 28), SFTPC-Muc5bTg demonstrated worse survival d and tissue injury e relative to wild type (+) littermates. Survival data in d were evaluated by χ2 statistic using 17 Muc5b−/−, 16 Muc5b+/+, 15 Scgb1a1- Muc5bTg, 23 Scgb1a1-Muc5b+(wt), 26 SFTPC- Muc5bTg, and 25 SFTPC- Muc5b+(wt), mice. f–i Scgb1a1- Muc5bTg, Muc5b−/−, and control mice were treated IT with bleomycin as in d. To induce similar levels of fibrosis while limiting survivor bias, SFTPC-Muc5bTg and controls received 2.0 U/kg bleomycin on day 0, followed by 1.0 U/kg on days 14 and 28. HP content increased in Scgb1a1-Muc5bTg and SFTPC-Muc5bTg but decreased in Muc5b−/− mice compared to wild type (+) controls for each strain. g–i Fibrillar collagen (magenta in g) was assessed in peripheral lung tissues by confocal/multi-photon fluorescence microscopy with SHG. h, i Fibrillar collagen volumes following bleomycin were increased per mouse h and showed heterogeneous distributions i in Tg mice compared to controls. Data in i were analyzed by t-test (n = 105 Scgb1a1-Muc5bTg and 105 Scgb1a1-Muc5b+(wt) images, and n = 120 SFTPC-Muc5bTg and 120 Scgb1a1-Muc5b+(wt) littermate images. Scale bars, 10 μm a, b, c, 250 μm e, and 100 μm g. In f and h, data are means ± sem, numbers in italics indicate n animals used per experiment, and p-values indicate differences determined by ANOVA with Holm-Sidak’s multiple comparisons test. In i, * indicates statistical significance (p < 10−5)

