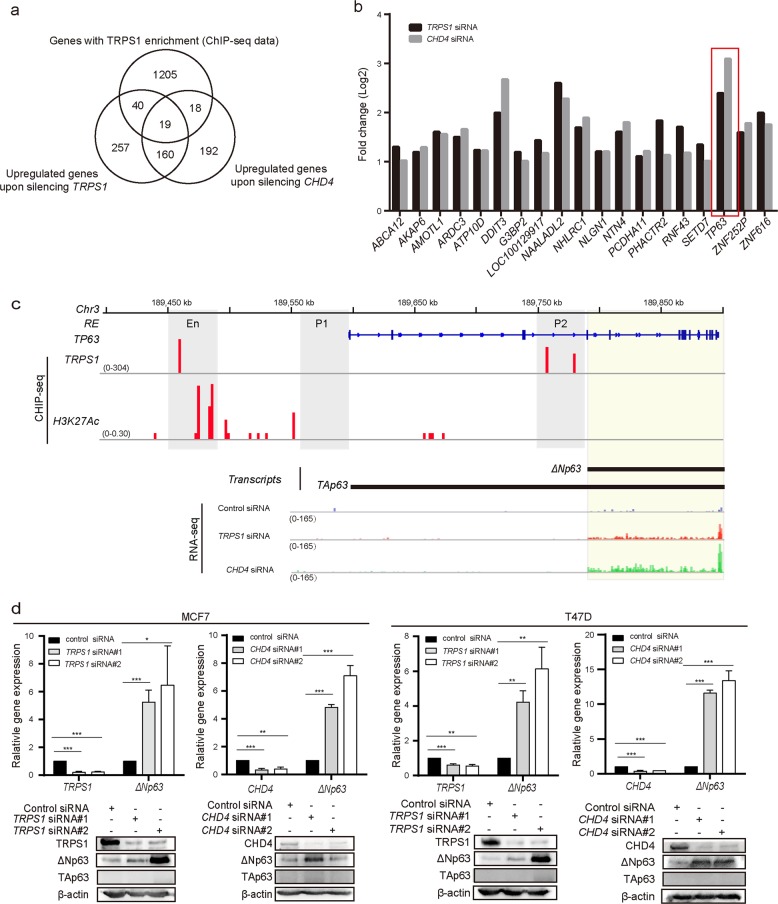
Fig. 4. TRPS1-CHD4/NuRD(MTA2) regulates ΔNp63 expression by targeting regulatory region of TP63.
a Venn diagram displays overlapping gene analysis of TRPS1 ChIP-seq-enriched genes and RNA-seq data of upregulated genes after the TRPS1and CHD4 knockdown. b Histogram of upregulated TRPS1 enrichment genes after TRPS1 and CHD4 knockdown. c ChIP-seq track of TRPS1 occupancy in the TP63 regulatory region and RNA-seq track of the TP63 gene expression. En, P1, and P2 indicate the enhancer, P1 promoter, and P2 promoter region of TP63, respectively. d ΔNp63 was upregulated at the mRNA and protein levels upon silencing TRPS1 or CHD4. Each bar represents the mean ± SD for triplicate experiments. t Test was used for statistical significance calculation. *p < 0.05, **p < 0.01, ***p < 0.001

