Fig. 1.
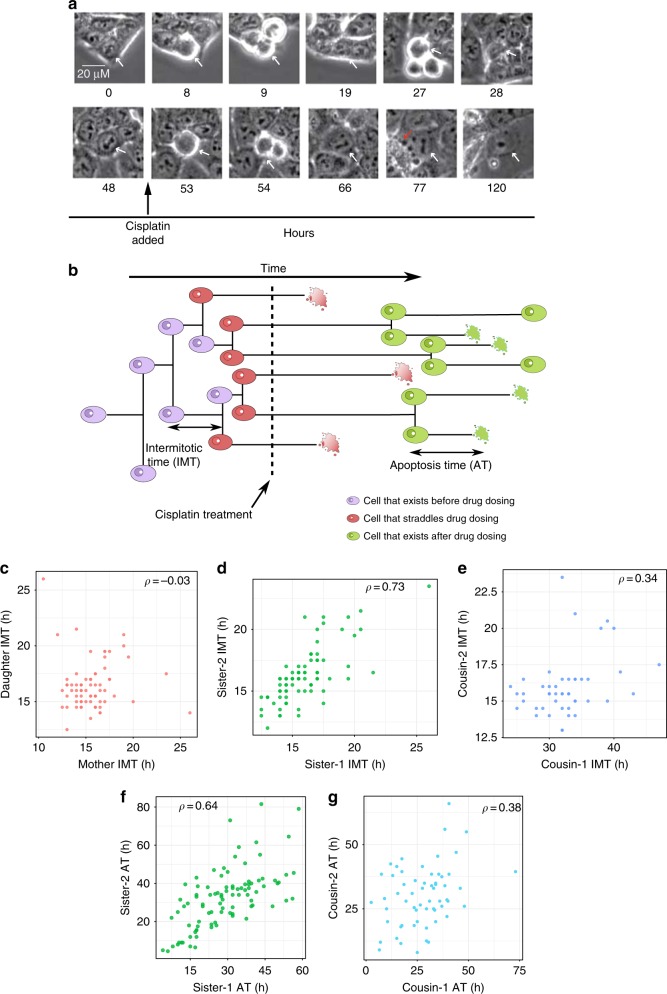
Correlations in HCT116 cells before and after cisplatin treatment in a single cell lineage-tracking experiment. a Example of live-cell imaging of a single cell before and after cisplatin. The white arrow points to the cell tracked. The red arrow at hour 77 highlights an apoptotic cell. Images are shown for each cell division. Scale in top left image is 20 μm. b Cartoon representation of the time-lapse microscopy experiment. Cells that are born and divide before cisplatin addition are colored purple, cells born before cisplatin treatment that eventually divide or die after treatment are red, and cells that exist purely after cisplatin administration are in green. c–e Lineage correlations in inter-mitotic times of cells existing before cisplatin treatment (purple cells in b). Pearson correlations (ρ) are shown on top of each panel, and colors for lineage correlations are maintained throughout the text. The mother–daughter correlation is for 71 pairs, P-val = 0.7, 95% CI [−0.26, 0.16]. The sister correlation is for 80 pairs, P-val = 2.9 × 10⁻¹⁴, 95% CI [0.6, 0.8]. The cousin correlation is ρ = 0.34 for 46 pairs, P-val = 0.02, 95% CI [0.1, 0.57]. Cousin correlations are higher than the mother–daughter correlation, a phenomenon called the cousin–mother inequality12. f, g Lineage correlations in times to death of cells treated with cisplatin (red and green cells in b). Note that by definition mother–daughter pairs do not exist for cells that die. for 93 sister pairs, P-val = 3.09 × 10⁻¹², 95% CI [0.48, 0.78]; for 60 cousin pairs, P-val = 0.001, 95% CI [0.15, 0.54]. Statiistical significance of the correlations was computed by a t-test (Supplementary section 1)

