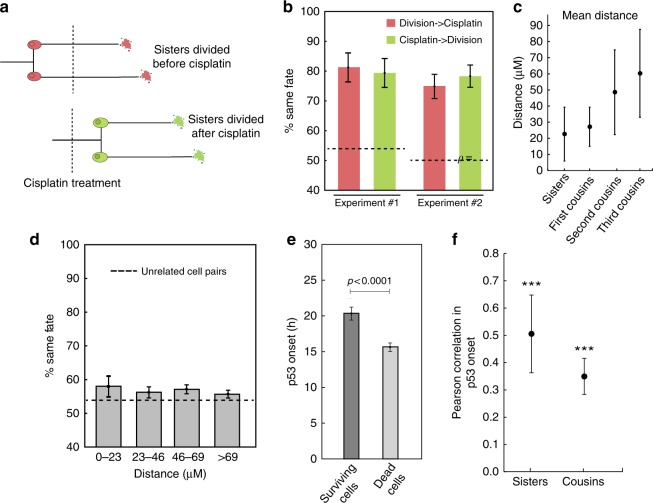
Fig. 2.
Cell fate and p53 dynamics are correlated in sisters and cousins. a Sister cell pairs were divided into two groups: those that divided before or after cisplatin treatment. b The percentage of sisters in each group that share the same fate. Experiment #1 N = 61, N = 108, for experiment #2 N = 150, N = 150. The dashed lines represent the % of unrelated cells that share the same fate. c Mean distance separating cells when cisplatin was added by relationship N = 61, 259, 414, 533. The centroid of the nucleus was used for the location of each cell. Euclidean distances were computed for every pair of cells. d % of unrelated cell pairs that share the same fate grouped by distance separating cells when cisplatin was added. N = 243, 896, 1341, 1791. Sister cells were on average 23 μM apart. The dashed line is the same as in b Error bars for c, d are standard deviation. e p53 onset in apoptotic cells was faster than in surviving cells. N = 144, 250. Error bars represent standard error of the mean. Significance by t-test (f) p53 onset was correlated among sister and cousin cells. ***P < .0001. See methods for calculations of significance

