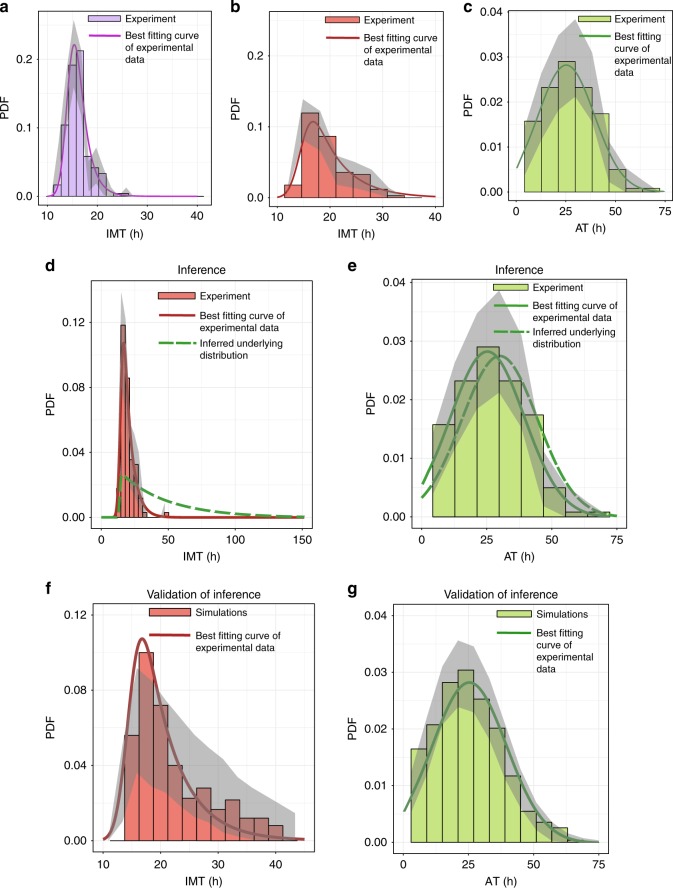
Fig. 3.
Quantifying hidden heterogeneity induced by cisplatin. The color code follows Fig. 1b. a Probability density function (PDF) of the IMT before cisplatin treatment, with a mean of 16.1 h. b IMT PDF of cells straddling the cisplatin administration event. Mean time is 20 h, indicating a slowing down of the cell cycle after cisplatin administration. As explained in the main text, this is a biased estimate of the mean cell cycle time. c Apoptosis time PDF measured directly from the data. The experimental data in a–c are shown as histograms derived from 160, 104, and 186 data points respectively. The corresponding best-fitting Exponentially Modified Gaussian (EMG) distributions are shown as solid curves. Gray shaded areas represent 95% confidence intervals generated from 1000 bootstrapped samples of the data. Parameters for the curves are given in Supplementary section 4. d, e Experimental data and inferences from our algorithm. d The inferred IMT distribution after cisplatin addition is shown as a green dashed curve. The inferred heterogeneity using our statistical model (standard deviation of the green dashed curve) is 33.05 h while existing inference techniques20 using the red histogram would have incorrectly concluded 5.65 h. e The inferred apoptosis time distribution after cisplatin is shown as a green dashed curve. As expected for a scenario where the average death rate is higher than the division rate, the inferred time to death distribution is not heavily biased, unlike the inferred IMT distribution in d. f–g Validation of our inferences using birth-death process simulations. f The histogram represents one example of the observed IMT distribution from our birth-death process simulations, using the data generating the green dashed lines from panels d and e as inputs. The close match between the histogram and the red solid line representing the data validates our inference procedure and inferred IMT distribution. g Similar to f, but for the apoptosis time distribution. Parameters for the inferred distributions (dashed lines) are given in Supplementary Table 5 and parameters obtained from fits to the data (solid red or green lines) are given in the Supplementary section 4. The gray shaded areas in f, g denote 95% confidence intervals generated from 500 simulations

