Fig. 6.
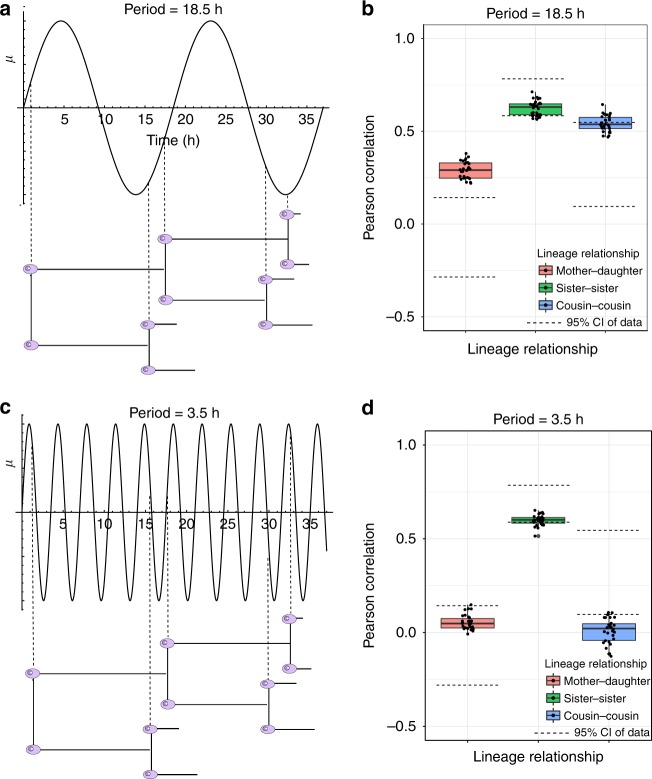
Most oscillator time periods fail to capture the correlation structure in intermitotic times. a Schematic of an oscillator with an 18.5 h gating of the cell cycle. The inter-mitotic times shown are ~16 h, as observed in the pre-cisplatin HCT116 cells. The standard deviation was chosen as ~2 h to mimic the inferred width of the IMT distribution in Fig. 5b. The dashed vertical lines indicate the phase of the oscillator when a particular cell was born. Similar phases at cell birth result in positively correlated cell division times. This schematic provides an intuitive explanation for the correlation structure obtained from simulations shown in b. b Lineage correlations obtained from simulations when the oscillator has a time period of 18.5 h. The mother–daughter correlations are larger than observed in the data. c Similar to a but for an oscillator with a 3.5 h period. The rapid oscillations and IMT heterogeneity combine to result in random phases at which cousins are born, leading to negligible cousin-correlations as seen in d. d Similar to b but for an oscillator with a 3.5 h period. The cousin correlation is negligible and hence does not recapitulate the experimental data. Parameters used to generate these plots were chosen to generate observed sister correlations (details in Supplementary section 6). All boxplots represent the 1st, 2nd, and 3rd quartiles of the lineage correlations generated from 30 simulation runs

