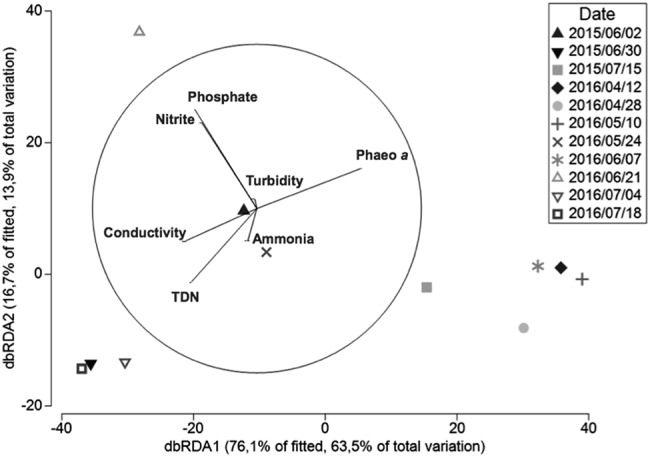
Fig. 3.

The dbRDA ordination representing the results of the DistLM analysis in 2D. DistLM is used to examine the relationship between the distribution and temporal dynamics of V. mediterranei G1 APP and all-measured environmental variables. Vectors represent predictor variables used for the construction of the constrained ordination (the dbRDA diagram), and the length of the vectors represents the explanatory percentage of each variable. The analysis is detailed in Table 2
