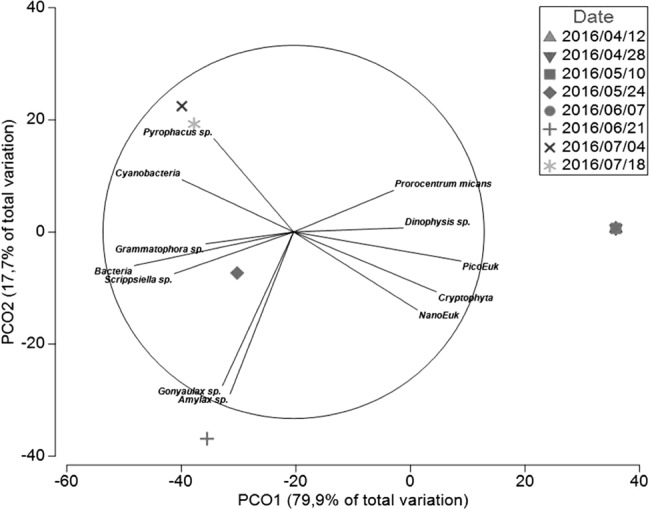
Fig. 4.

Principal co-ordinate plot (PCO) of V. mediterranei G1 phenotypes for the first and second principal co-ordinates using the Bray–Curtis similarity matrix. Phytoplankton and bacterial counts were used as predictor variables, are shown here only the variable with Pearson correlation > 0.45. The analysis is detailed in Supplementary Table 4 and the contribution of each variable in the construction of PCO axis (Pearson correlation) is detailed in Supplementary Table 5
