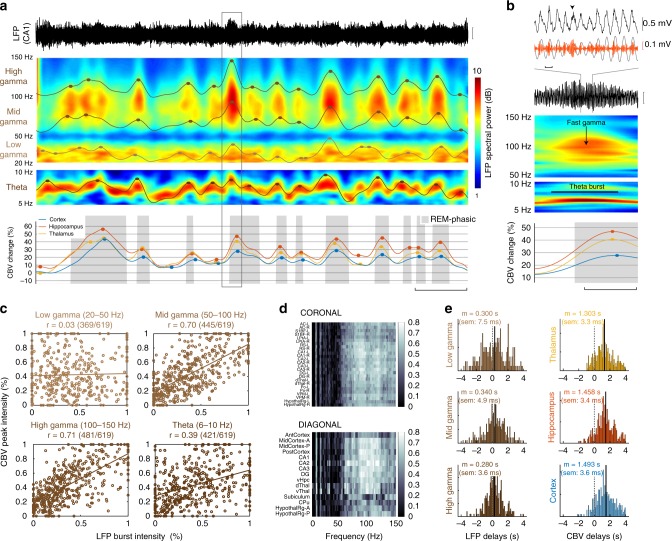
Fig. 3.
Hippocampal theta and fast gamma bursts precede vascular surges. a CA1 Hippocampal LFP trace (top) time-frequency spectrograms with four LFP envelopes (middle) and regional CBV dynamics (bottom) for a typical REM sleep episode. Solid circles mark the regional peaks for LFP and CBV signals. Note that each vascular surge (gray box) is preceded by sustained activity in the theta, mid-gamma, and high-gamma bands. Note that we can pair up LFP peaks (brown/black dots) with corresponding vascular peaks (color dots) to investigate LFP-CBV coupling. Scale bar: 30 s. b Typical LFP precursor to a vascular surge (extended box shown in a). At the onset of the VS, CA1 hippocampal LFP shows prominent theta and fast gamma bursts, occurring on the ascending phase/peak of the theta cycle (gray curve). Upper scale bar: 100 ms. Lower scale bar: 5 s. c Scatter plot showing the correspondence between LFP peaks (x-axis) corresponding CBV peak (y-axis), for the four frequency bands shown in a. Note the strong correlations in the mid (50–100 Hz) and high (100–150 Hz) gamma bands, showing that hippocampal gamma predicts the amplitude of vascular amplification. The numbers in bracket specify the pairing ratio between LFP and CBV peaks. d Exhaustive analysis of LFP-CBV correlations for all brain regions and LFP frequency bands. Horizontal axis: LFP bands, Vertical axis: regional CBV variables. Each coefficient of matrices is obtained by generalizing the approach in c. Note that highest correlations are obtained for gamma-mid band (50–100 Hz) in the hippocampal (DG-CA1-CA3) and dorsal thalamic (dThal) regions. e Histograms of delays for the three LFP gamma sub-bands and the three CBV regions, relative to theta peaks. Note that cortical delays (m = 1.493 s) are longer than thalamic (m = 1.303 s) and hippocampal (m = 1.458 s) delays

