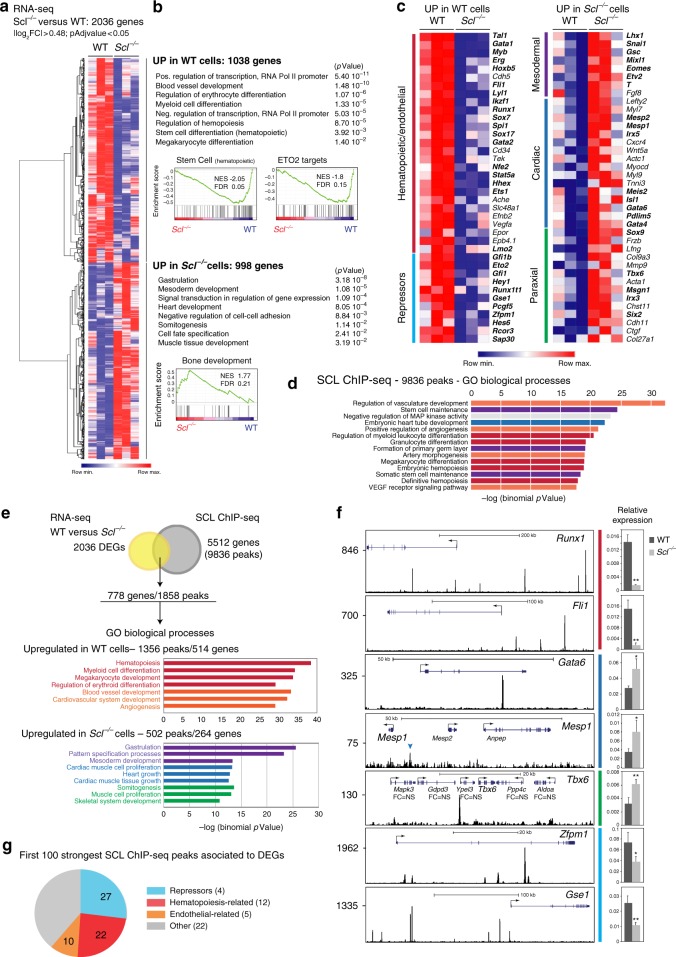
Fig. 4.
SCL controls distinct gene regulatory networks in day 3.5 FLK1+ cells. a Hierarchical clustering of RNA-seq data from day 3.5 WT and Scl-/- FLK1+ EB cells. b Gene ontology (GO) processes associated to differentially expressed genes (DEGs) (PANTHER and GSEA analyses). c Heatmap showing selected DEGs associated to GO processes identified in b. In bold, transcriptional regulators. d The top more significant GO biological processes associated to SCL-bound loci (GREAT analysis). e Integration of SCL ChIP-seq and RNA-seq data reveals 778 SCL direct differentially expressed target genes. Below, GO terms attributed to DEG-associated peaks (GREAT analysis). f Left, SCL ChIP-seq tracks of selected direct DEGs; FC = NS, fold-change in expression in Scl-/- cells is not significant (RNA-seq data). Tbx6 locus: the SCL peak was attributed to Tbx6, the closet DEG. Right, RT-qPCR gene expression analysis relative to Gapdh from WT and Scl-/- day 3.5 FLK1+ cells. n = 3, mean ± SD; student’s t-test, *p < 0.05, **p < 0.01. Colour code, same as in c. g Biological functions attributed to the 100 strongest DEG-associated SCL ChIP-seq peaks. In brackets, numbers of genes in each category. See also Supplementary Data 1, 2

