Figure 2.
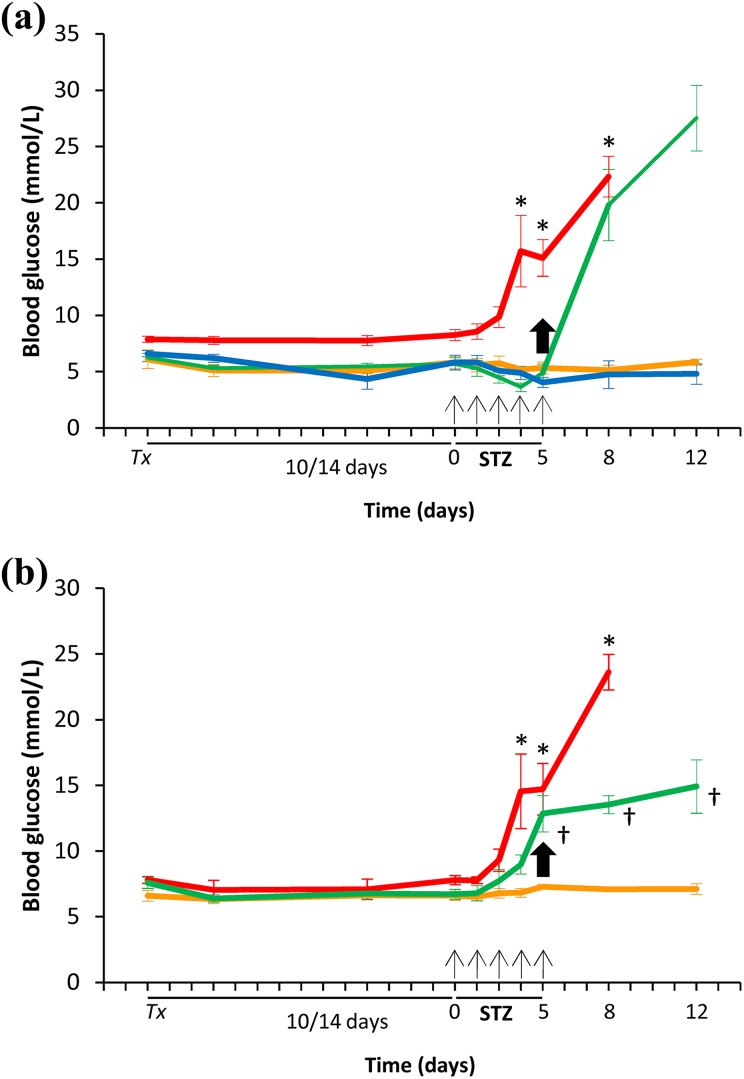
Metabolic evolution in mice transplanted with human and mouse islets, and treated with STZ. (a) Human islet transplantation. Green: Transplanted with 2000 islets, STZ treated (n = 8). Blue: Transplanted with 800 islets, STZ treated (n = 9). Red: Non-transplanted, STZ treated (n = 9). Orange: Transplanted with islets, vehicle treated (n = 6). Values are means ± SEM. ANOVA, p < 0.0001, with post-hoc Tukey’s test for multiple comparisons, *p < 0.05 v. STZ-treated and transplanted, and vehicle-treated and transplanted groups. (b) Mouse islet transplantation. Green: Transplanted, STZ treated (n = 8). Red: Non-transplanted, STZ treated (n = 9). Orange: Transplanted, vehicle treated (n = 7). Values are means ± SEM. ANOVA, p < 0.0001, with post-hoc Tukey’s test for multiple comparisons, *p < 0.05 v. STZ-treated and transplanted, and vehicle-treated and transplanted groups; †p < 0.001 v. vehicle-treated and transplanted group. Tx: transplantation day; STZ: streptozotocin; Arrows: STZ injection. Bold arrow: removal of the graft in transplanted (2000 islets) and treated with either STZ (green) or vehicle (orange) groups.

