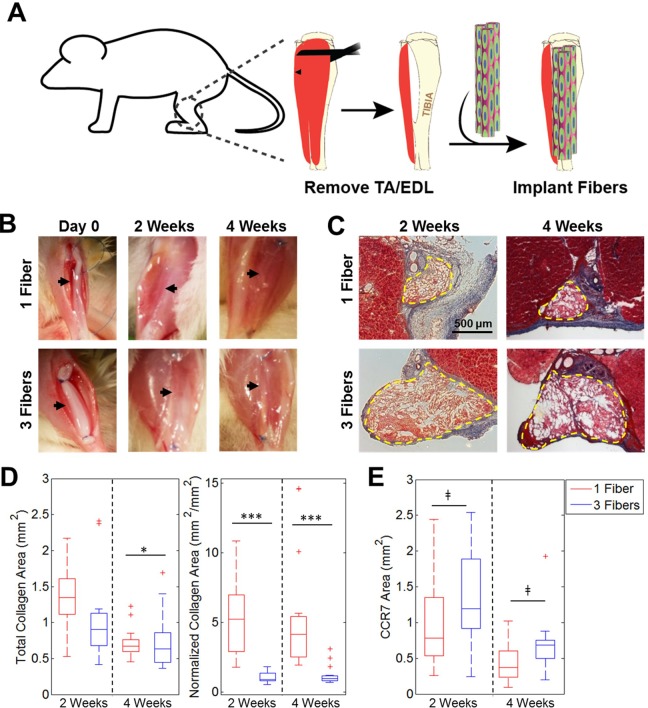
Fig 2.
Fibrosis resulting from implantation of acellular fibers into VML defect. (A) Schematic illustrating fiber implantation into a murine VML defect model. (B) Gross images of defects with 1 or 3 fibers/defect at Day 0 and 2 or 4 weeks post-transplantation. Black arrows illustrate fiber location within defect site. (C) Masson’s Trichrome staining demonstrates varying levels of fibrosis among groups. Dashed yellow lines denote fiber boundaries. (D) Quantification of total collagen area and normalized collagen area over time for both groups (n=14–15). (E) Quantification of total CCR7 staining area (n=15).
*p < 0.05. ***p < 0.001, ‡not significant.

