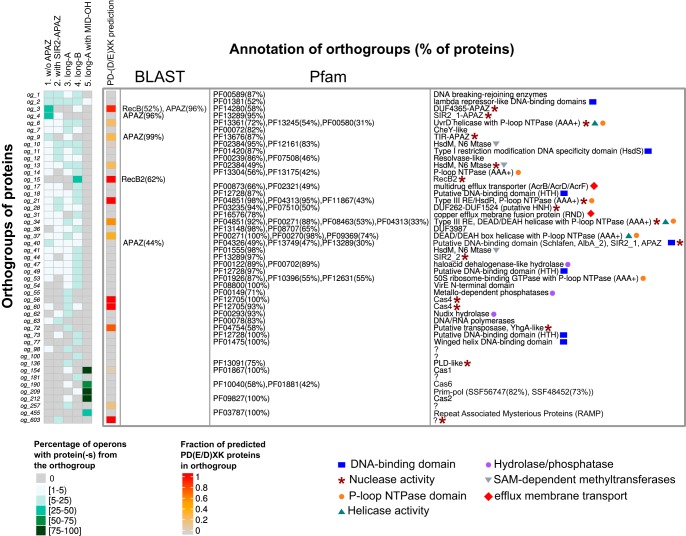
FIG 6.
Functional annotations of proteins encoded in pAgo operons. The heat map on the left shows the percentage of operons for each pAgo group (columns) that have at least one protein from the particular orthogroup (rows). The orthogroups are ordered according to the number of proteins in each group, from the largest to the smallest. Since many operons do not contain any proteins included in the orthogroups analyzed here, the total number of operons with orthogroup-specific proteins may be less than 100%. The PD-(D/E)XK column shows the fraction of proteins from each orthogroup that are predicted to be nucleases from the PD-(D/E)XK superfamily. The annotation of proteins was performed by BLAST analysis for identification of APAZ, RecB-like, and RecB2 domains and by InterProScan using the Pfam and Superfamily databases. Only the Pfam annotation of domains is shown (with the exception of og_209, for which the Superfamily annotation is shown). The percentage in the brackets after the domain name shows the fraction of proteins in the corresponding orthogroup having this type of domain. Since proteins may contain several domains, the sum of percentages in each row may be greater than 100%. Only Pfam or Superfamily domains found in at least 30% of orthogroup proteins are shown. The descriptions of domain functions are shown on the right of the panel. Proteins from several orthogroups do not have any known domains and are marked by “?.” After the manual curation of domain functions, several of the most common functional features were selected, which are shown as colored symbols and described below the table.

