
FIG 2.
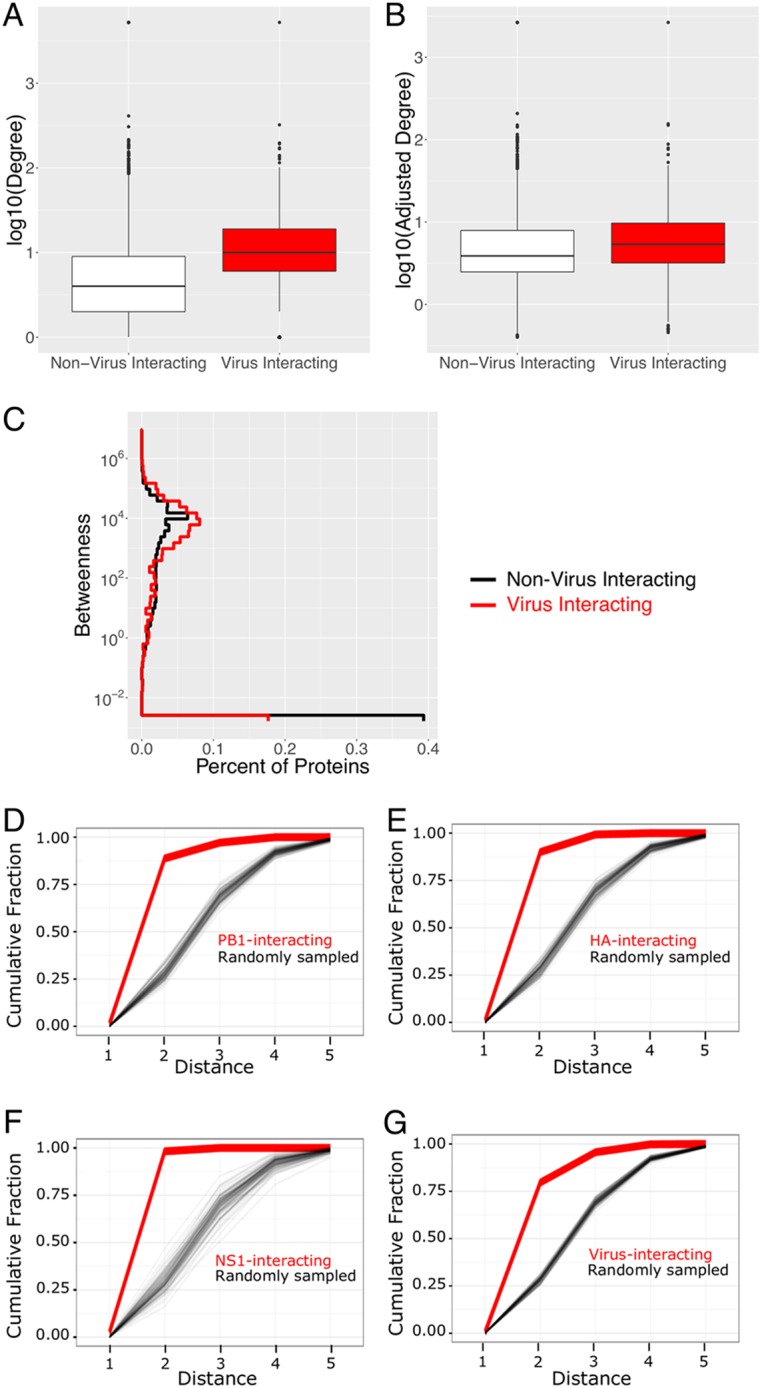
The network topological characteristics of virus-interacting host proteins. (A to C) Distributions of the degree (A), adjusted degree (B), and betweenness (C) of virus-interacting proteins and all proteins in the human PPI network. An ε of 0.01 was added to the betweenness to facilitate log scaling. (D to G) The cumulative distributions (thick red lines) of the shortest distances connecting host proteins in the PPI network that interact with viral PB1 (D), HA (E), or NS1 (F) protein or the set of all viral proteins (G). For a control, the cumulative distribution of distances was iteratively determined (N = 100) by randomly sampled host proteins in the PPI network (thin black lines). The number of proteins sampled on each iteration was equal to the number of interacting host proteins of each virus protein (or set of viral proteins).