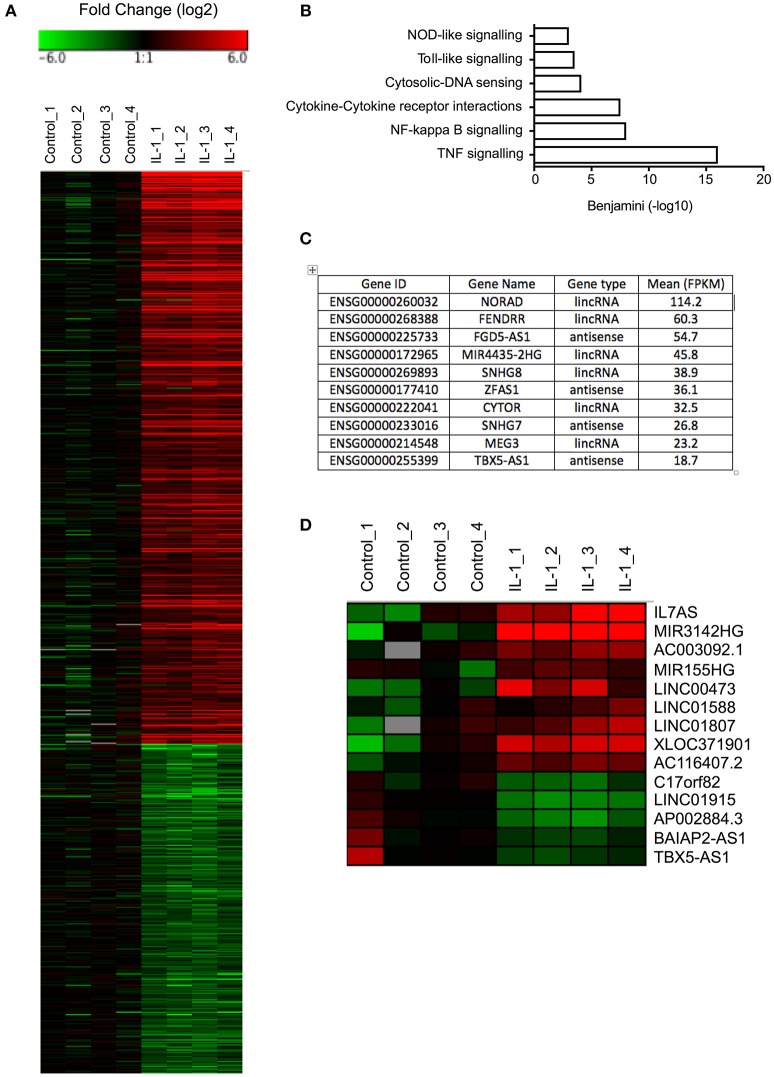
Figure 1.
Differential expression of mRNAs and lncRNAs following IL-1β-stimulation of control lung fibroblasts. (A) Heat map showing the differential expression of mRNAs in control fibroblasts following IL-1β stimulation for 6 h. (B) Pathway analysis of up-regulated mRNAs. (C) Top 10 most highly expressed lncRNA in non-stimulated control fibroblasts. (D) Heat map showing the differential expression of lncRNAs in control fibroblasts following IL-1β stimulation for 6 h.

