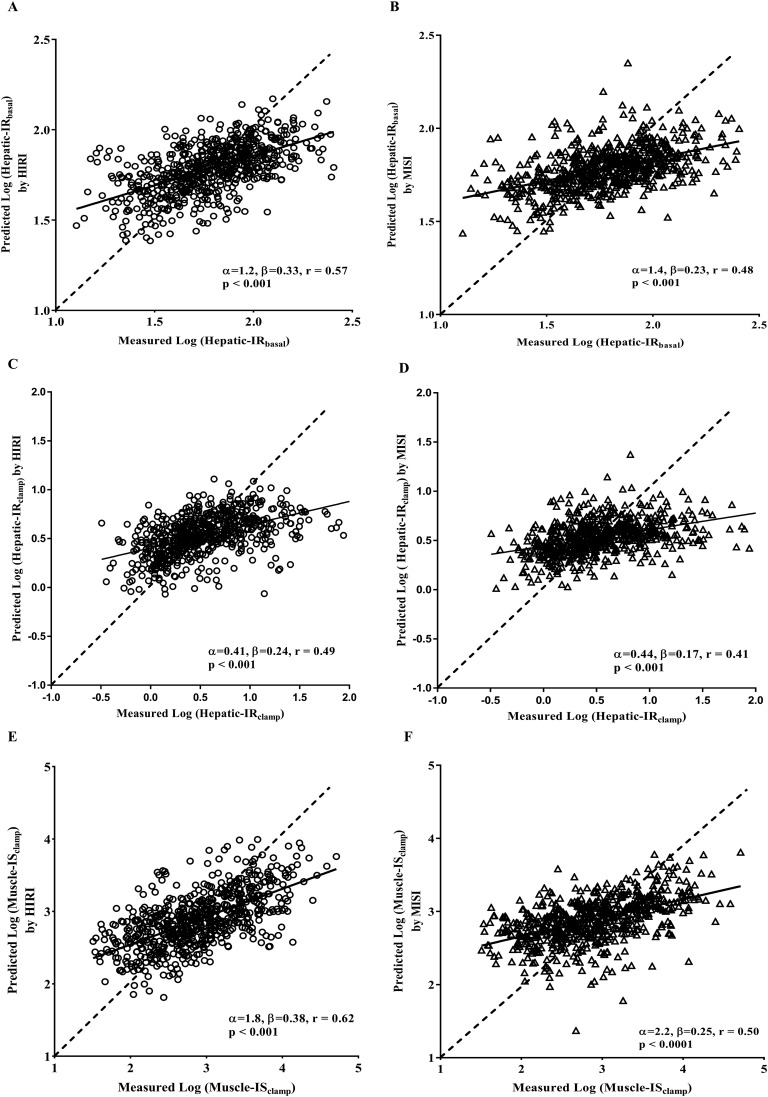
Figure 1.
Comparison between measured and predicted clamp insulin sensitivity/resistance measures (Hepatic-IRbasal, Hepatic-IRclamp, and Muscle-ISClamp) from tissue-specific surrogate indexes of insulin sensitivity/resistance. Predicted liver or muscle reference measures shown for each surrogate index were calculated using the leave-one-out cross-validation analysis of the calibration model as described in the research design and methods. The dashed line indicates ideal predictive accuracy. The solid line indicates the linear least-squares fit of measured vs predicted liver or muscle measure. Correlation coefficients (r) and respective P values are shown in each panel. (A, C, and E) Results derived from HIRI. (B, D, and F) Results derived from MISI.

