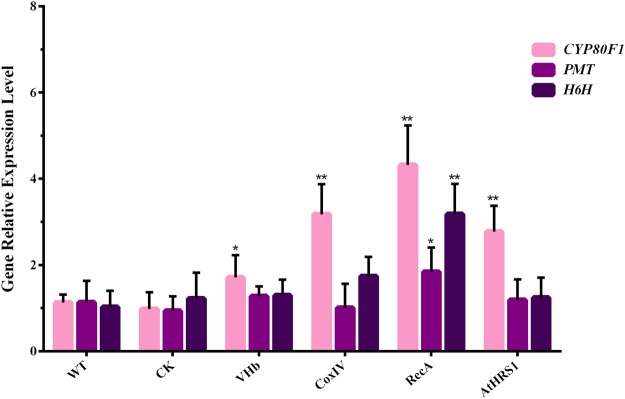
Figure 6.
Quantification of the transcripts of genes involved in the biosynthesis of tropane alkaloids in transgenic hairy root lines. Each set of bars corresponds to one transgenic line and, within each set, each color corresponds to a single gene. The replicates of independent transgenic lines are as depicted in Table 1. Error bars show the standard deviations for the independent lines. The level of significance obtained using One-Way ANOVA is indicated as follows: *p < 0.05, **p < 0.01.

