Figure 4.

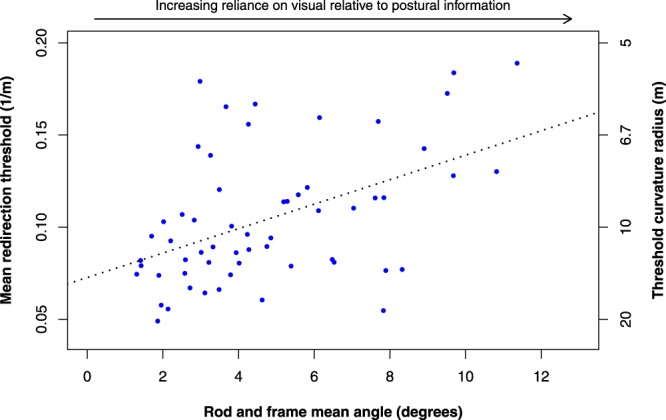
Mean redirection thresholds plotted against the variable rod-and-frame mean angle. Mean redirection thresholds are given in gain units and the corresponding curvature radii. The regression line is shown (R2 = 0.23, p = 0.0002).

Mean redirection thresholds plotted against the variable rod-and-frame mean angle. Mean redirection thresholds are given in gain units and the corresponding curvature radii. The regression line is shown (R2 = 0.23, p = 0.0002).