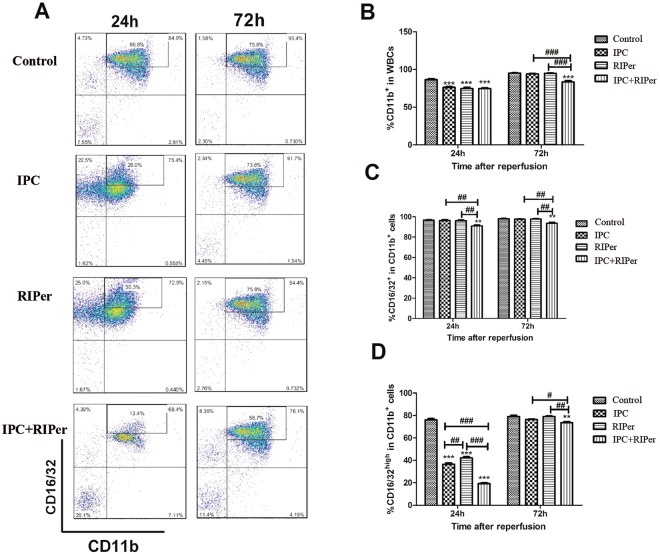
Figure 3.
Effect of different maneuvers on the activation of myeloid cells. (A) Representative flow cytometry plot of WBCs stained with anti-CD11b and anti-CD16/32 in control, IPC, RIPer and IPC + RIPer group. (B) Percentages of CD11b+ cells in WBCs. (C,D) Percentages of CD16/32+ cells and CD16/32high in CD11b+ cells. *p < 0.05; **p < 0.005; ***p < 0.0005 vs control group, paired Student t-test. #p < 0.05; ##p < 0.005; ###p < 0.0005 vs different conditioning method, one-way ANOVA and Bonferroni post-hoc test.

