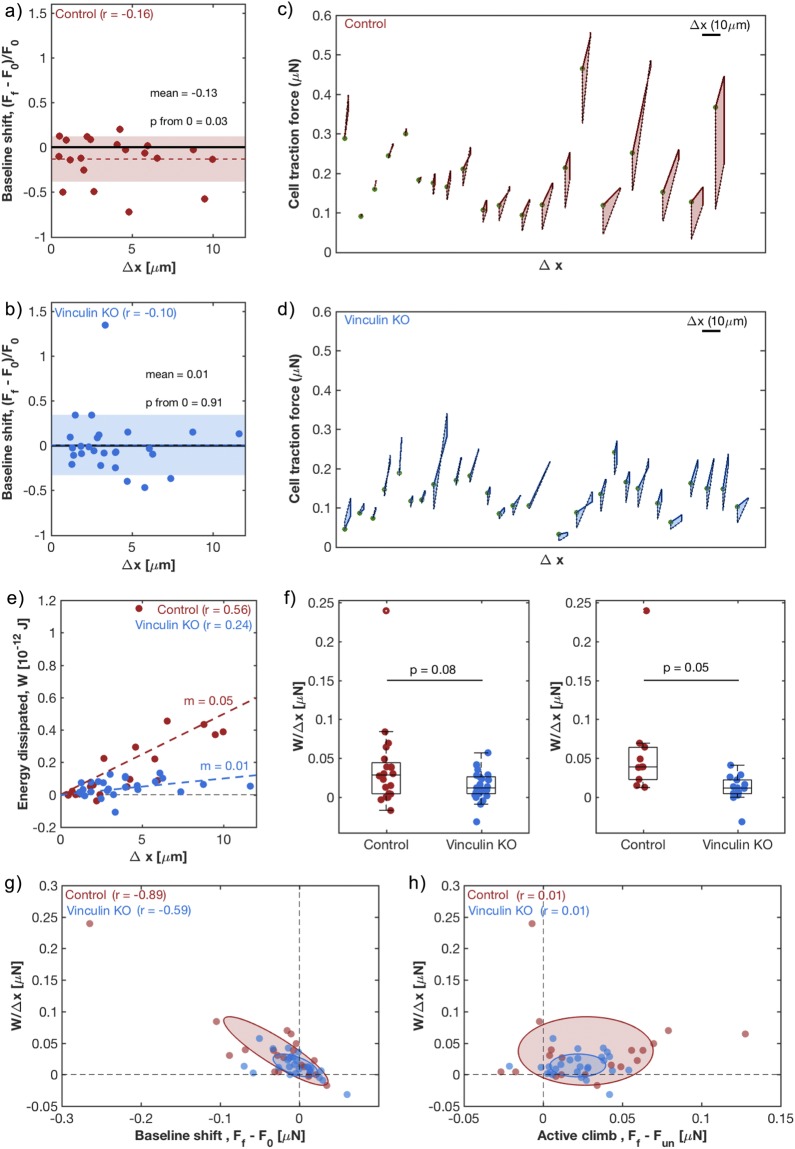
Figure 4.
Dissipated energy in the stretch cycle is correlated with a baseline shift in traction forces. (a,b) Shift in baseline traction forces throughout the entire stretch and release process, , normalized by the initial baseline, F0, for control (a) and vinculin KO (b) cells. Each data point represents a single cell and the colored region spans the mean +/− standard deviation. Low Pearson’s correlation coefficient (r) values suggest no relation between baseline shift and the change in cell length, (c,d) Force-displacement diagram for control (c) and vinculin KO (d) cells, showing total traction force of each individual cell throughout the cycle of stretch and release. Cells are arranged from left to right based on the area inside this curve, which is the dissipated mechanical energy. Scale bar shows the scale of change in cell length. Green dots indicate each cell’s initial traction force/zero displacement point. (e) Dissipated energy, W, for each cell as a function of cell length change. For control cells (red), a moderate r value and a positive fit slope (m) suggest a linear correlation. For vinculin KO cells (blue), a low r and small m, suggest a lack of correlation. (f) The dissipated energy per unit length, across control (red) and vinculin KO (blue) cells, for the full population (left) and for cells with >3 µm (right). Each data point represents a single cell while the box and whisker plots summarize the population. The middle line represents the median of the population, while the box top and bottom represent the 1st and 3rd quartile, respectively. p-values were calculated by Welch’s t-test. Means from left to right: 0.037, 0.014, 0.059, 0.011 µN. (g) Relationship between dissipation per unit length, and baseline traction force shift,. Moderate to high negative r values suggest a strong anti-correlation. (h) The relationship between the dissipation per unit length, and active climb in force after un-stretch,. Very low r values suggest a lack of relation. (g,h) Each data point represents a single cell. The axes of the ellipses are the eigenvectors of the covariance matrix between x and y coordinates. The widths of the ellipses are the square root of the variances along these vectors, showing the variation in the populations.

