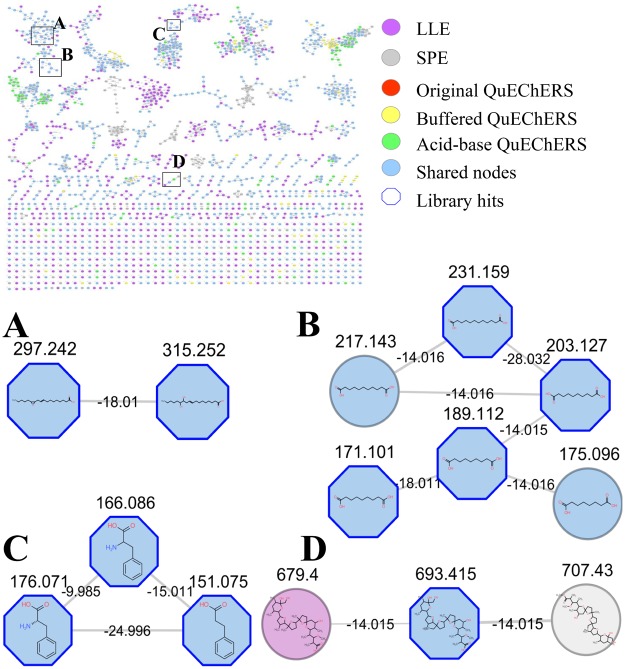
Figure 2.
Molecular network (MN) generated using molecular features from the rumen fluid of a non-lactating dairy cow extracted using liquid-liquid extraction (LLE); solid-phase extraction (SPE); original, buffered and acid-base QuEChERS and analyzed using ultra-high performance liquid chromatography coupled to a high resolution mass spectrometer in tandem. Ellipse shaped nodes with gray border indicate putative assignments and octagon nodes with blue border indicate hits with Global Natural Products Social (GNPS). Purple, gray, red, yellow and greed nodes represent molecular features extracted exclusively with LLE, SPE, original, buffered and acid-base QuEChERs, respectively. Blue nodes represent molecular features extracted by more than one extraction method. m/z of mass shift between the nodes are displayed over the edges. (A) Octagon nodes with blue border indicate spectral match of the GNPS with 12,13-EpOME ([M+H]+; m/z 297.2430) and 12,13-DiHOME ([M+H]+; m/z 315.2534). (B) Octagon nodes with blue border indicate spectral match of the GNPS with azelaic acid ([M+H]+; m/z 189.112 and [M-H2O+H]+; m/z 171.101), decanedioic acid ([M+H]+; m/z 203.127) and dodecanedioic acid ([M+H]+; m/z 231.159); ellipse nodes with gray border indicate putative assignments to undecanedioic acid ([M+H]+; m/z 217.143) and suberic acid ([M+H]+; m/z 175.096). (C) Octagon nodes with blue border indicate spectral match of the GNPS with phenylalanine ([M+H]+; m/z 166.086), 3-indoleacetic acid ([M+H]+; m/z 176.071) and hydrocinnamic acid ([M+H]+; m/z 151.075). (D) Octagon node with blue border indicate spectral match of the GNPS with monensin ([M +Na]+; m/z 693.415) and ellipse nodes indicate its analogues monensin B ([M+Na]+; m/z 679.402) extracted exclusively on LLE, and monensin methyl ester ([M+Na]+; m/z 707.433) extracted exclusively on SPE.

