
Figure 5:
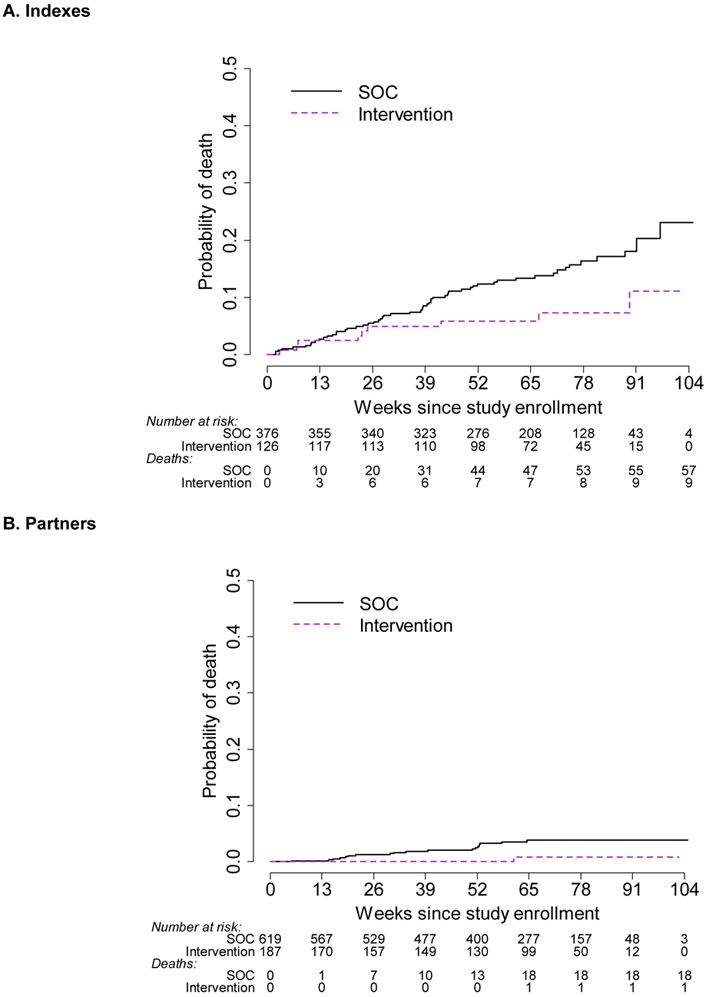
A. Time to death for index participants. B. Time to death for partner participants. Cumulative probability plots of death for indexes (A) and partners (B). At each time point below the x-axis, the number remaining at risk is provided, as well as the number of accumulated deaths. Note that the number of participants with follow-up beyond 91 weeks is limited. Purple dashed line: intervention; black solid line: standard of care.