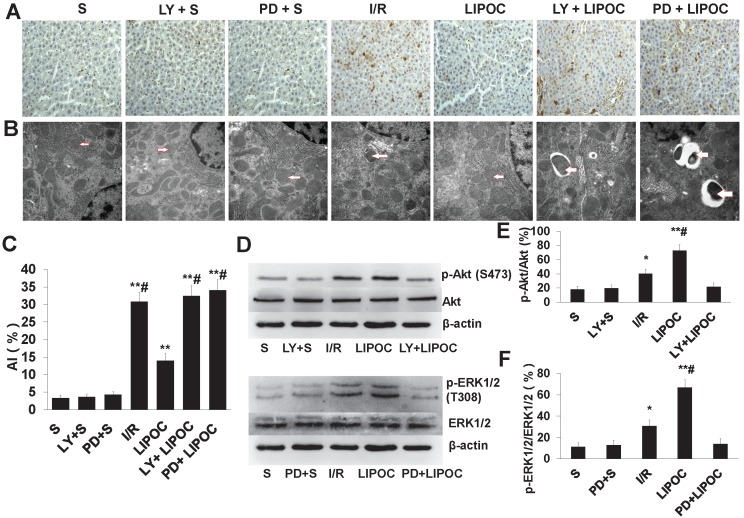
Figure 5.
The effects of LIPOC and RISK pathways on hepatocyte apoptosis and ultrastructural changes. (A) TUNEL staining for liver tissue of rats from each tested group (x400 magnification). (B) Pathological changes in liver sections under electron microscope (x30,000 magnification). The structural changes of mitochondria are indicated by the arrows. (C) The quantification of AI using TUNEL staining. Compared to S group: **P<0.01; compared to LIPOC group: #P<0.05. (D) Western blotting analysis for the expression and phosphorylation of Akt and ERK1/2 among different treatments. (E) Quantification of Akt expression and phosphorylation with different treatments. (F) Quantification of ERK1/2 expression and phosphorylation with different treatments.

