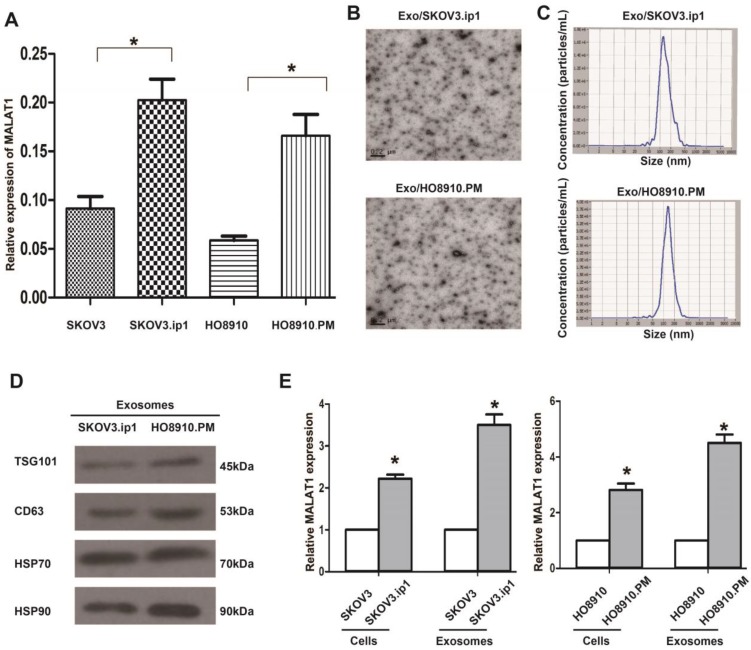
Figure 1.
Relative MALAT1 levels in EOC cells and their secreted exosomes. (A) qRT-PCR analysis shows that MALAT1 levels in the highly metastatic EOC cells (SKOV3.ip1, HO8910.PM) were higher than those in their parental cells. The data represent the means ± standard deviation (SD) of three independent experiments. The error bars denote the SD. * P<0.05. (B) Transmission electron microscopy images of Exo/SKOV3.ip1 and Exo/HO8910.PM. (C) Nanoparticle tracking analysis to determine the size distribution of Exo/SKOV3.ip1 and Exo/HO8910.PM. The representative size distribution peaks of Exo/SKOV3.ip1 and Exo/HO8910.PM appear at 121 nm and 132 nm, respectively. (D) Western blotting analysis of the exosomal markers CD63, TSG101, Hsp 70 and Hsp 90 in Exo/SKOV3.ip1 and Exo/HO8910.PM. (E) qRT-PCR analysis of MALAT1 expression in EOC cells (SKOV3.ip1, HO8910.PM, SKOV3, and HO8910) and in their secreted exosomes. * P<0.05.

