Figure 3.
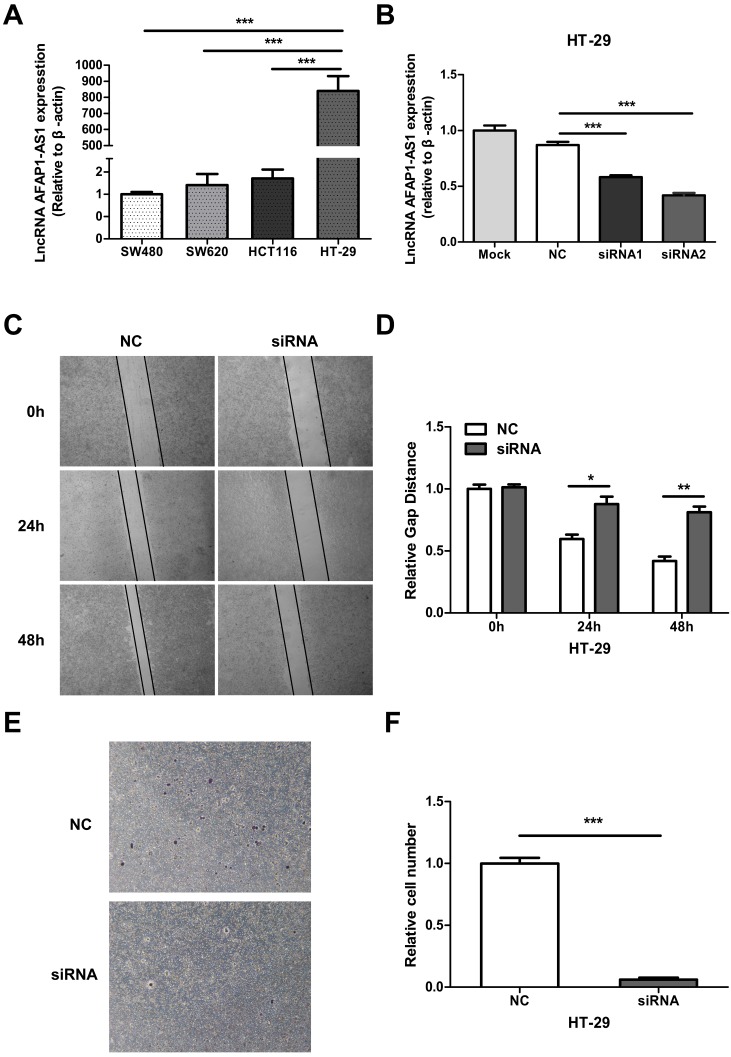
AFAP1-AS1 knockdown inhibits cell migration and invasion. (A) AFAP1-AS1 expression levels across four CC cell lines were measured by qRT-PCR. (B) Expression levels of AFAP1-AS1 in HT-29 cells were measured by qRT-PCR after transfected with siRNAs targeting AFAP1-AS1 (siRNA1 and siRNA2), or a scrambled negative control (NC). qRT-PCR results indicated that the siRNA2 had the strongest inhibitory effect. (C) Representative images of cells that migrated into the scratched area and (D) the gap distance of each groups at 0 h, 24 h and 48 h. (E) Representative images of invasive cells transfected with NC or with siRNA2. (F) Measurement of the relative number of invaded cells in each group.*P< 0.05, **P < 0.01, ***P < 0.001.

